Your Azure bill lands, and the number is higher than expected. The frustrating part isn't just the cost. It's not knowing which machines stayed on too long, which diagnostics kept flowing all night, or which monitoring settings turned into a quiet tax on the environment.
A lot of teams use azure log analyzer as a troubleshooting tool and stop there. That's leaving money on the table. Log Analytics can show you where compute is idle, where log volume is unnecessary, and which patterns repeat often enough to justify automation. Once you treat logs as financial signals, not just operational noise, cost control gets much easier.
Why Your Azure Bill is High and How Log Analytics Can Help
Most Azure overspend starts with visibility gaps. Teams add VMs, enable monitoring, turn on extra insights, and keep resources running because nobody wants to break production. A few weeks later, the environment looks healthy on paper but waste has spread across always-on servers, oversized usage windows, and growing ingestion.
This hits small and midsize businesses especially hard. Microsoft guidance around workspace usage helps, but SMB teams still struggle with unpredictable ingestion bills. One documented gap in current Azure Log Analytics content is practical cost optimization for SMBs, even as Azure adoption has reached 123,627 tracked companies and uncontrolled logs can consume 30-50% of monitoring budgets per anecdotal reports according to Microsoft's usage analysis discussion at Azure Monitor log usage analysis.
The first fix isn't "optimize everything." The first fix is to identify where spend and telemetry move together.
What Log Analytics reveals fast
A good workspace tells you three things quickly:
- Which VMs are active vs. merely powered on. Heartbeat, performance, and event data make it obvious when a machine exists mostly to wait.
- Which monitoring settings create cost without useful action. If teams collect logs they never query, that spend is easy to challenge.
- Which anomalies deserve a human review. A finance-minded team should pair native telemetry with broader spend analysis and anomaly detection so unusual billing patterns don't hide inside technical dashboards.
Practical rule: If a VM is "critical" but nobody can show when it's actually used, treat it as a scheduling candidate until proven otherwise.
There's also a common platform gap. Native tools are strong for querying and investigation, but they're weaker at proactive cost control. That's why many teams complement Azure analysis with policy-based shutdown strategies and cost-focused operational routines like those discussed in Azure cost optimization practices.
The business goal behind the queries
If you only use Log Analytics after an outage, you're operating reactively. If you use it to find idle workloads, correlate telemetry patterns, and define when systems should be off, you're using it as a FinOps tool.
That shift matters. Troubleshooting keeps systems running. Cost analysis keeps the business from paying for systems that don't need to run.
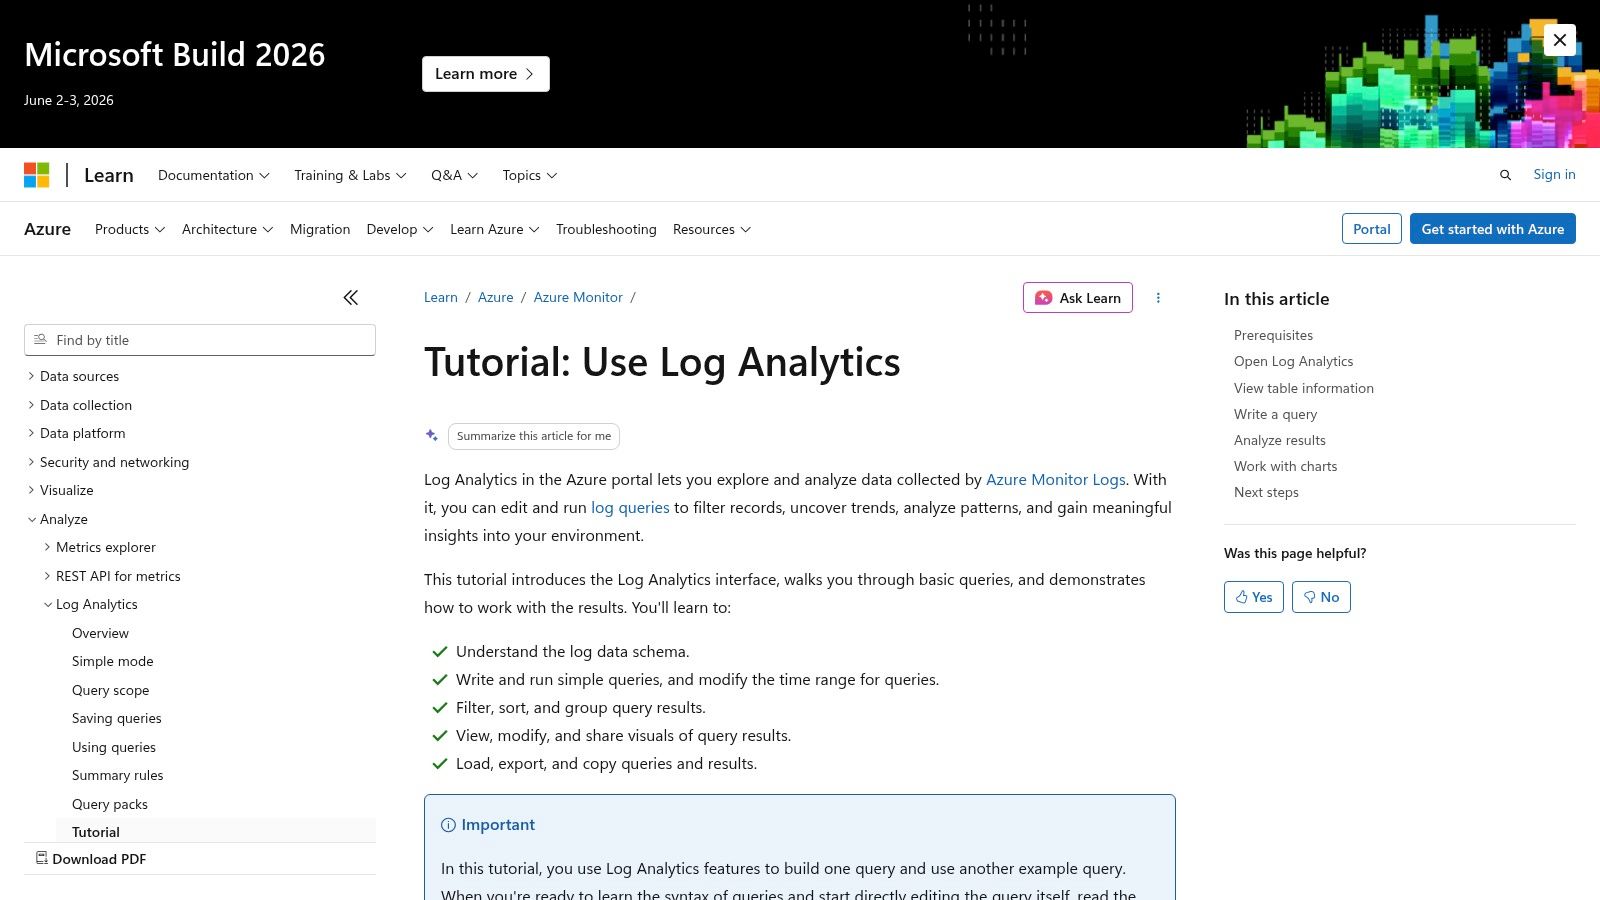
Setting Up Your Log Analytics Workspace
Before querying anything, you need a clean workspace design. Azure Log Analytics runs inside Azure Monitor and stores incoming data in a Log Analytics Workspace, often shortened to LAW. Data from virtual machines, storage accounts, applications, and other Azure resources lands there in structured tables, which you query with KQL. This architecture supports near-real-time retrieval and multiple use cases, but the portal interface has a 30,000-result retrieval limit per query session, so large environments need tighter query design from the start, as described in this Log Analytics architecture overview.
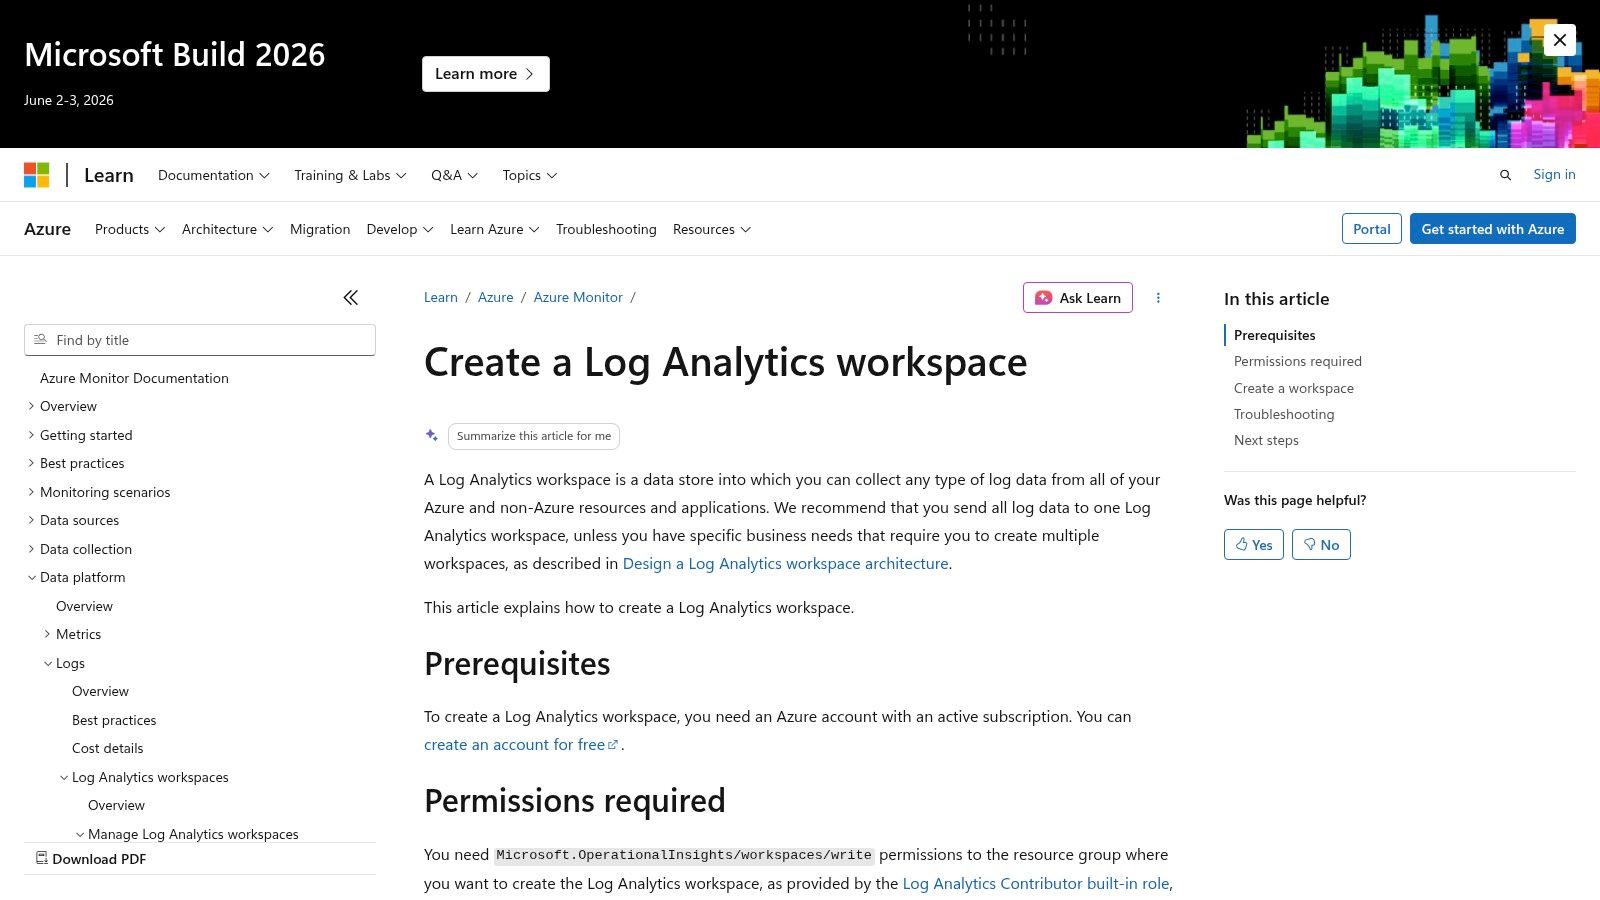
Create the workspace with future queries in mind
In the Azure portal, search for Log Analytics workspaces and create a new one. The mechanics are simple. The decisions are not.
Pick a resource group and region that fit your operational model. If your team manages workloads by business unit, don't dump every team into one giant workspace by default. A workspace should make access, cost review, and ownership clearer, not blurrier.
Use naming that survives growth. A pattern like law-prod-shared-eastus tells you more than logs-main.
A few setup habits save time later:
- Name for ownership. Include environment and scope in the name so engineers know whether a workspace is shared, app-specific, or production-only.
- Align with access boundaries. If different teams should review only their own data, reflect that in workspace design early.
- Plan for query limits. Broad "give me everything" searches fail fast in larger environments. Time-bounded queries and summarized results work better.
A messy workspace doesn't just slow analysis. It makes cost review political because nobody agrees on who owns the data.
Connect the data sources that matter first
A new workspace without connected sources is just an empty container. Start with the assets that usually drive cost decisions first, especially virtual machines.
For Azure VMs, connect them so they send the logs and performance data you plan to use. Focus on signals that help answer real questions like "Was this machine active?" and "Did it need to stay on overnight?" It's easy to over-collect on day one and regret it later.
Good first candidates include:
- Virtual machines for heartbeat and operational data
- Core Azure resources that support the workloads you're trying to right-size
- Diagnostic streams tied to actual decisions, not just curiosity
If you need a deeper walkthrough on workspace organization and LAW basics, this guide on Log Analytics Workspace design and usage is a useful companion.
Keep governance simple at the start
Don't try to perfect retention and table strategy on the first pass. Get a working workspace online, confirm data is flowing, then inspect table growth and query usefulness over a normal operating cycle.
What matters early is discipline:
| Decision area | Good default |
|---|---|
| Scope | Separate by ownership or environment when access needs differ |
| Naming | Include environment, function, and region |
| Onboarding | Start with VMs and high-value operational sources |
| Querying | Use time windows and summarize operators |
A usable workspace is better than an ambitious one nobody trusts.
Writing KQL Queries to Uncover Waste
KQL is where azure log analyzer becomes useful for cost work. You don't need advanced syntax to start. You need a few repeatable queries that answer one question clearly: which resources are running without doing enough work to justify the spend?
Start with heartbeat before performance
Heartbeat data is usually the fastest way to spot systems that stay alive continuously. It won't tell you whether a VM is useful. It tells you whether it's present.
Use this to find machines reporting consistently over the last day:
Heartbeat
| where TimeGenerated > ago(24h)
| summarize Heartbeats=count(), FirstSeen=min(TimeGenerated), LastSeen=max(TimeGenerated) by Computer
| order by Heartbeats desc
This query gives you a basic inventory of machines that have been active in the last day. A VM with constant heartbeats becomes a candidate for deeper review, especially if the business says it only supports office-hour workloads.
Breakdown of the query:
where TimeGenerated > ago(24h)limits the data set to a practical review windowsummarizerolls many records into one line per computerFirstSeenandLastSeenhelp you spot whether reporting was continuous or partial
Find VMs that look idle
The next step is checking whether those machines show signs of actual use. A practical pattern is to compare CPU-related counters over a recent window and highlight low-activity machines.
Perf
| where TimeGenerated > ago(24h)
| where ObjectName == "Processor" and CounterName == "% Processor Time" and InstanceName == "_Total"
| summarize AvgCPU=avg(CounterValue), MaxCPU=max(CounterValue) by Computer
| order by AvgCPU asc
This isn't a shutdown command. It's a shortlist. Low average CPU over a meaningful period often points to machines that are powered on "just in case."
Use the output carefully:
- Low average CPU and low max CPU usually indicates a strong idle candidate
- Low average CPU but occasional spikes suggests the VM may support batch work or background tasks
- One day of data isn't enough for policy. Review at least several business cycles before automating
Field note: Don't shut down a server because one query says it's quiet. Shut it down when multiple signals say it's quiet and the application owner agrees on the schedule.
Look for no-network patterns
CPU isn't the whole story. Some systems are mostly I/O driven. Others stay up but don't exchange meaningful traffic outside a narrow window.
This query checks network traffic counters:
Perf
| where TimeGenerated > ago(24h)
| where ObjectName == "Network Interface"
| where CounterName in ("Bytes Total/sec")
| summarize AvgNetwork=avg(CounterValue), MaxNetwork=max(CounterValue) by Computer
| order by AvgNetwork asc
If a VM has low CPU and minimal network activity, the case for scheduling gets stronger. That's especially true for internal tools, jump boxes, test servers, and department-owned workloads that nobody formally retired.
Compare business hours against off-hours
A lot of waste hides in machines that are needed during the day and forgotten at night. This pattern is more useful than a blunt idle list because it supports schedule design.
Perf
| where TimeGenerated > ago(7d)
| where ObjectName == "Processor" and CounterName == "% Processor Time" and InstanceName == "_Total"
| extend HourOfDay = datetime_part("Hour", TimeGenerated)
| extend UsageWindow = case(HourOfDay between (8 .. 18), "BusinessHours", "OffHours")
| summarize AvgCPU=avg(CounterValue), MaxCPU=max(CounterValue) by Computer, UsageWindow
| order by Computer asc
You can export or pin this output and review machines where business-hour activity exists but off-hours activity stays consistently low. That's the profile of a strong weekday schedule candidate.
Here's a useful explainer before you build your own variations:
Quantify the effect of shutdowns
One of the most overlooked uses of Log Analytics is measuring the impact of start-stop policy. Microsoft documentation around Log Analytics overview often doesn't connect this directly to scheduling, yet it notes that scheduled shutdowns can reduce log volume by 40-60% overnight, and that teams can quantify the change by querying Heartbeat before and after shutdown periods. The same discussion also notes 20-30% savings potential for SMBs when idle compute reduction is paired with log-aware cost control, as referenced in the Log Analytics overview discussion.
A simple comparison query looks like this:
Heartbeat
| where TimeGenerated > ago(7d)
| extend HourOfDay = datetime_part("Hour", TimeGenerated)
| extend Window = case(HourOfDay between (8 .. 18), "BusinessHours", "OffHours")
| summarize HeartbeatCount=count() by Computer, Window, bin(TimeGenerated, 1d)
| order by TimeGenerated asc
This doesn't calculate Azure cost by itself. It gives you evidence. If off-hours heartbeat volume drops after a schedule starts, you've shown that the VM isn't just off. It's no longer generating the same stream of operational data.
What works and what doesn't
What works:
- Short, focused time ranges
- Summarized output instead of raw log dumps
- Combining heartbeat, CPU, and network indicators
- Review with app owners before automation
What doesn't:
- One giant workspace query across everything
- Judging a production VM from one metric alone
- Using logs for discovery but never converting findings into policy
- Treating every low-usage machine as safe to power off
The goal isn't to write fancy KQL. The goal is to create a list of defensible cost actions.
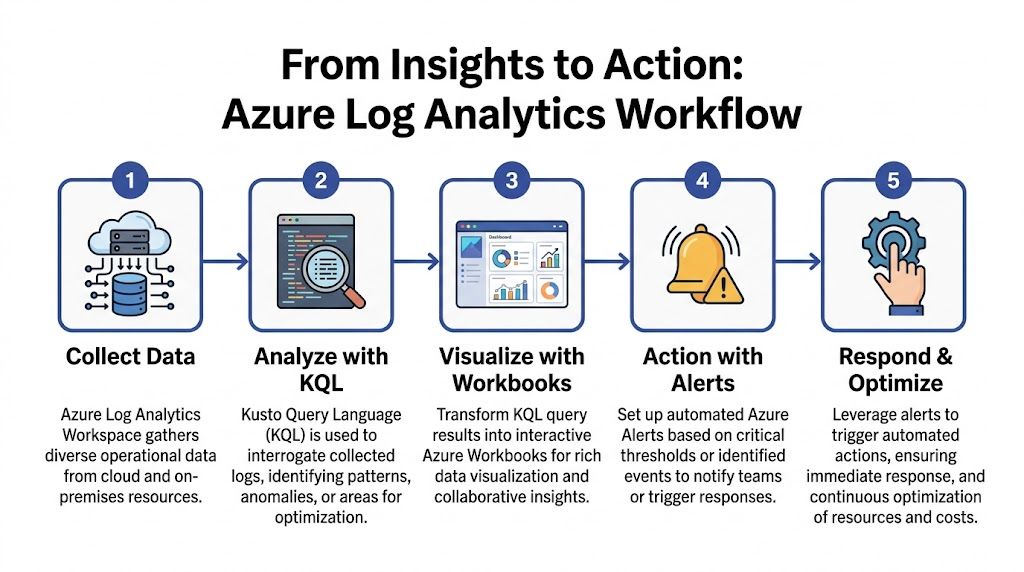
From Insights to Action With Workbooks and Alerts
Queries are useful in the editor. They become operational when the rest of the team can see them without opening KQL every morning. That's where Azure Workbooks and alert rules start pulling their weight.
Build one workbook that answers one cost question
Don't start with a giant observability dashboard. Build a single workbook around a cost decision, such as Idle VM review.
Good workbook elements include:
- A table of low-activity VMs from your CPU and heartbeat queries
- A trend chart by day so teams can see whether low usage is persistent
- Filters by subscription, resource group, or environment to support ownership reviews
A simple workbook often beats a beautiful one. Engineers and finance stakeholders both need to understand the result quickly.
The best workbook for cost control is the one a team actually opens during weekly review.
Use log tiers intentionally
Storage tiering matters when you operationalize dashboards. Azure Log Analytics supports four log storage tiers designed to balance cost, query performance, and retention. Analytics logs support full KQL and near-real-time troubleshooting. Basic logs are lower cost with more limited functionality. Archive logs support longer-term retention, and Search Jobs help retrieve relevant historical records without pulling full time windows. This tiered design lets teams keep routine monitoring on cheaper tiers while reserving Analytics for heavier investigation, as outlined in this Log Analytics storage tier explanation.
That leads to a practical workbook strategy:
| Use case | Better fit |
|---|---|
| Current idle VM review | Analytics logs |
| Routine startup and shutdown tracking | Basic logs |
| Historical audit review | Archive logs |
| Targeted historical retrieval | Search Jobs |
If every dashboard depends on the most expensive query path, your monitoring practice can become part of the problem.
Turn workbook logic into alerts
A workbook is for visibility. An alert is for response.
Create an alert rule from a query that identifies a clear condition, such as a VM showing repeated heartbeat activity overnight when it shouldn't. Keep the rule simple enough that an operator knows what to do when it fires.
A good alert setup usually includes:
- A narrow query condition. Avoid vague "something changed" logic if you're aiming for cost action.
- A clear action group. Send it to the team that owns the machine, not to everyone.
- A response expectation. Decide whether the alert is informational, approval-based, or tied to an automation workflow.
What native tooling does well
Azure's native stack is strong when you need to collect, query, visualize, and notify from one platform. It's also useful for anomaly detection and policy enforcement around operational thresholds.
But native alerts still depend on people acting on them. If the team gets an email at 7:15 p.m. saying a dev VM is still running, somebody still has to decide whether to ignore it, shut it down, or create a schedule.
That's the point where many teams realize that insights without consistent follow-through don't cut spend reliably.
Automating Cost Optimization with Your Findings
Manual review doesn't scale well. A team can identify idle machines every Friday and still fail to reduce spend because nobody wants to be the person who powers off a server at the wrong time.
That's why alert-driven cost control usually stalls. Alerts create awareness. They don't create consistency.
Where manual action breaks down
The weak points show up quickly:
- Inbox fatigue. Teams stop noticing routine idle alerts.
- Ownership confusion. Nobody knows who can safely act on a VM.
- Exception handling. Temporary project work changes schedules, but the process for updating them is slow.
- Permission sprawl. Giving broad cloud-console access just so someone can manage start-stop routines creates risk.
Those aren't technical query problems. They're operating model problems.
Convert repeated findings into schedules
Once your Log Analytics review identifies stable patterns, convert them into explicit start-stop policy. The ideal candidates are usually non-production systems, office-hours workloads, internal tools, and test environments with predictable usage.
A sound process looks like this:
- Review recurring idle patterns from your KQL and workbook outputs.
- Confirm business-hour requirements with the workload owner.
- Group machines by shared schedule needs.
- Apply recurring schedules rather than relying on repeated human intervention.
- Allow temporary overrides for release windows, patching, or special projects.
That last step matters more than is often realized. A schedule without easy overrides gets bypassed. A schedule with controlled overrides gets used.
Why policy beats reminders
A reminder says, "Please remember to save money."
A policy says, "This machine powers off unless someone has a reason to keep it on."
That's a healthier default for SMB operations teams. The process becomes predictable, reviewable, and less dependent on heroics. If you're building that kind of operating model, this write-up on cloud automation for cost control is worth reading because it frames automation as a governance tool, not just a convenience feature.
Automating shutdown is less about aggressive savings and more about removing the daily chance that nobody acts.
What to automate first
Don't automate every candidate at once. Start where mistakes are cheap and schedules are obvious.
Good first automation targets:
- Development VMs used during working hours
- Test servers that don't need overnight uptime
- Internal tools with known user windows
- Training and demo environments that sit idle outside planned sessions
Leave ambiguous systems out until ownership and usage are clear. Cost optimization works best when it feels boring. If every schedule creates debate, the process is still immature.
Frequently Asked Questions About Azure Log Analyzer
Is azure log analyzer the same as Azure Monitor
Not exactly. Azure Log Analytics operates within Azure Monitor. Azure Monitor is the broader telemetry platform. It collects metrics, logs, activity data, and service health information. Log Analytics is the query and analysis experience centered on workspace data and KQL.
If you're new to the stack, think of Azure Monitor as the umbrella and Log Analytics as the workspace-based analysis layer inside it.
How should I think about pricing without guessing
Start with the components you control directly: what data you ingest, how long you retain it, and which tier you store it in. Teams usually get into trouble when they enable a lot of collection before deciding what they need to query regularly.
The practical way to manage spend is:
- Collect for a decision, not for curiosity
- Review high-volume tables regularly
- Move less-used data into lower-cost storage options when it fits the use case
- Watch changes after enabling new insights or diagnostics
That approach won't give you a universal benchmark, but it will give you a defendable internal baseline.
Can I use Log Analytics beyond Azure resources
Yes. Log Analytics isn't limited to native Azure services. Teams often use it as a centralized operational data store across mixed environments. The key is to onboard sources intentionally and keep the workspace organized enough that cross-environment queries still make sense.
If you're supporting both cloud and non-cloud systems, keep ownership and tagging standards tight. Cross-platform visibility is valuable only when the data remains attributable.
Why isn't my data appearing in the workspace
Check the simple failures first.
- Connection status. Confirm the resource is configured to send data to the intended workspace.
- Time range. A lot of "missing data" cases come down to a query window that's too narrow.
- Table selection. New users often search the wrong table and assume ingestion failed.
- Permissions. Sometimes the data exists, but the user can't see what they expect.
What's the most common mistake in cost-focused Log Analytics work
Teams query waste and stop there. They produce a list of idle machines, discuss it in a meeting, and never turn the finding into a repeatable schedule or ownership rule.
That creates the illusion of control. Savings usually show up only after the team connects insight, approval, and automation into one operating routine.
If you're ready to move from spotting idle Azure resources to consistently shutting them down on schedule, CLOUD TOGGLE gives teams a straightforward way to automate start-stop policies, share scheduling access safely, and apply quick overrides when plans change. It's a practical next step when your Log Analytics findings are clear but manual follow-through keeps slipping.