Think of the AWS Cost and Usage Report (CUR) as the ultimate itemized receipt for your entire cloud footprint. While your main billing dashboard gives you the total, the AWS Cost and Usage Report delivers a line-by-line breakdown of every single charge, turning your bill from a mysterious number into a goldmine of actionable data.
Unlocking the Value of Granular Cloud Cost Data
If you've ever stared at a hefty AWS bill and wondered where all that money actually went, you know exactly why the CUR exists. A simple total is nice, but it tells you nothing about the "why" behind your spending. It completely hides the details you need to make smart financial decisions and find real savings.
Without this granular view, trying to identify waste is just a guessing game. You might see that your EC2 spending is high, but is that because of oversized instances in your dev environment? Or maybe it's untagged resources from a project someone forgot about? It could even be inefficient data transfer patterns you didn't know existed. The CUR tells you.
Why the CUR is the Foundation of FinOps
For any organization serious about Cloud Financial Management (FinOps), the AWS Cost and Usage Report is the absolute cornerstone. It provides the raw, ultra-detailed data you need to move from just reacting to high bills to proactively managing your cloud spend. It's the most comprehensive source of billing data AWS offers, hands down. You can dig into the nitty-gritty details in the official AWS documentation.
This report isn't just a file; it's a detailed financial logbook of everything happening in your infrastructure. It finally answers the crucial questions every team running on AWS should be asking:
- What specific services are we paying for? This goes beyond just "S3" and breaks it down by storage type, API requests, data transfer, and more.
- Which teams or projects are driving our costs? With good tagging discipline, the CUR makes precise cost allocation and chargebacks straightforward.
- When are we spending the most money? Hourly granularity can instantly reveal patterns, like development servers being left on all night.
- How well are we using our discounts? The report details your Savings Plans and Reserved Instance usage, showing you if you're actually getting the full value you paid for.
By providing this level of detail, the CUR empowers teams to take ownership of their cloud consumption. It transforms cost management from a centralized finance function into a distributed responsibility, which is a core principle of successful FinOps. It gives engineers the data they need to make cost aware architectural decisions.
To help you quickly grasp what the CUR brings to the table, here’s a quick summary of its core features and benefits.
AWS Cost and Usage Report Key Features at a Glance
| Feature | Description | Primary Benefit |
|---|---|---|
| Comprehensive Data | Includes every line item for all AWS services, accounts, and regions, updated multiple times a day. | Provides a single, authoritative source for all cloud cost and usage information. |
| Hourly Granularity | Offers the option to break down usage and cost data to the hour or even the resource ID level. | Helps identify short-term spending spikes and opportunities for resource scheduling. |
| Cost Allocation Tags | Integrates with user-defined and AWS-generated cost allocation tags. | Enables precise cost attribution to projects, teams, or business units. |
| Pricing & Discounts | Details public, on-demand pricing alongside your specific discounts from RIs, Savings Plans, and more. | Shows the real-world impact of your commitments and helps optimize discount usage. |
| S3 Delivery | Delivers report files (in Parquet or CSV format) directly to a specified Amazon S3 bucket. | Allows for secure, durable storage and easy integration with data analysis tools. |
| Data Integration | Designed to be easily ingested by services like Amazon Athena, Redshift, and QuickSight for analysis. | Unlocks advanced analytics, custom dashboards, and business intelligence reporting. |
This table shows that the CUR is much more than just a bill. It's a powerful dataset designed for deep analysis and strategic cost management.
Setting Up Your First Cost and Usage Report
Getting your first AWS Cost and Usage Report (CUR) up and running is the single most important thing you can do to get a handle on your cloud spending. The process is pretty straightforward. You’ll just need to head over to the AWS Billing and Cost Management dashboard and tweak a few key settings. Once it's set up, you’ll start getting the raw, detailed data that underpins any real FinOps effort.
Everything starts in the AWS Management Console. Make your way to the Billing and Cost Management section, which is the command center for all your AWS financial data. This is where you'll kick off the process.
Navigating to the CUR Creation Page
Once you're in the Billing and Cost Management dashboard, find “Cost & Usage Reports” in the navigation pane on the left. This will land you on the main CUR page. From here, you can manage existing reports or, in our case, create a new one. Go ahead and click the button to start the creation wizard.
The wizard does a good job of breaking down what could be a confusing process into a simple, step-by-step flow. You won't get lost.
The first screen you see gives you a quick overview of the setup steps.
Right away, it asks you to name your report and choose some important data options, like including resource IDs. You'll also point it to an S3 bucket where the report files will be delivered, making sure it has the right permissions to drop the files there.
Configuring Report Details and Granularity
This is where you make the decisions that really matter. The settings you choose here will dictate how detailed your data is and what format it arrives in.
The most critical choice is the time granularity. You can choose between hourly, daily, or monthly. For any serious analysis, hourly granularity is the only way to go. It gives you the finest level of detail, letting you spot quick spending spikes and truly understand usage patterns. This is essential if you're trying to find resources you can shut down overnight or on weekends.
There are a few other toggles you absolutely need to get right:
- Include resource IDs: Always, always check this box. If you don't, you'll only see costs at the service level (e.g., "EC2 cost $500"), not which specific instance is driving the bill. Without resource IDs, you’re flying blind and can’t take targeted action.
- Report versioning: You can either have AWS create new report files with each update or just overwrite the old one. Creating new versions is the safest bet. It gives you a complete historical record of your spending data, which is invaluable for tracking trends over time.
- Data integration: AWS offers a handy shortcut to automatically set up integrations with services like Amazon Athena, Redshift, or QuickSight. This is a great time-saver, as it preps the data for querying the moment it lands in S3.
Setting Up S3 Bucket Delivery and File Format
The last piece of the puzzle is telling AWS where to send the files. The CUR isn't something you view in the console; it's a set of data files delivered to an Amazon S3 bucket that you own. You can pick an existing bucket or create a new one right from the setup screen.
A word of advice: create a dedicated S3 bucket just for your CUR files. This keeps your critical billing data organized, secure, and separate from your application logs or other data. Getting the bucket policy right is crucial for the delivery to work.
You'll also need to pick a file format. AWS gives you two options: CSV and Apache Parquet. While CSV is easy to open in any spreadsheet program, Parquet is vastly superior for both cost and performance, especially for large datasets. Because Parquet is a columnar format, tools like Athena can scan less data, which means your queries run faster and, more importantly, cost you less money. For any team watching its budget, this is a no-brainer.
Once you’ve confirmed all these settings and verified the S3 bucket policy, you're ready to create the report. AWS will start generating your first report and deliver it to your S3 bucket, usually within 24 hours.
How to Analyze Your CUR Data with AWS Services
Once your AWS Cost and Usage Report files start landing in your S3 bucket, you've got your hands on a goldmine of financial data. But in their raw form, these are just massive text files, not exactly easy to read. To turn all that data into real, actionable insights, you need a way to ask it questions.
Thankfully, AWS gives you a powerful, serverless stack to do just that.
This process is all about transforming millions of individual line items into clear answers for your biggest cost questions. The main tools for the job are AWS Glue, Amazon Athena, and Amazon QuickSight. Together, they create a data analysis pipeline that lets you run standard SQL queries directly on your CUR files without ever having to spin up or manage a single server.
H3: Cataloging Your Data with AWS Glue
First things first, you need to make sense of the raw data. Think of AWS Glue as a digital librarian for the data sitting in your S3 bucket. It scans your CUR files, figures out their structure (the columns and data types), and builds a metadata table.
This table acts like a card catalog, making your data discoverable and ready to be queried. Glue uses a component called a crawler to inspect the data automatically. You just point it at your CUR folder, and it identifies the format (like Parquet or CSV) and registers the schema in the AWS Glue Data Catalog.
It's a simple but absolutely essential step. Without it, other services would have no idea how to read those giant files. The crawler builds a map that Amazon Athena can follow to run its queries.
H3: Querying Your Data with Amazon Athena
With your data neatly cataloged, Amazon Athena steps up to the plate. Athena is an interactive, serverless query service that lets you analyze data in S3 using plain old standard SQL. No complex data loading required because it queries the data right where it lives.
The best part? You only pay for the queries you run. This makes it an incredibly cost-effective way to dig into your CUR data. You just open the Athena console, select the database and table that Glue created, and start writing SQL just like you would with a traditional database.
This visual shows how smoothly these services work together, starting from the moment you set up the report.
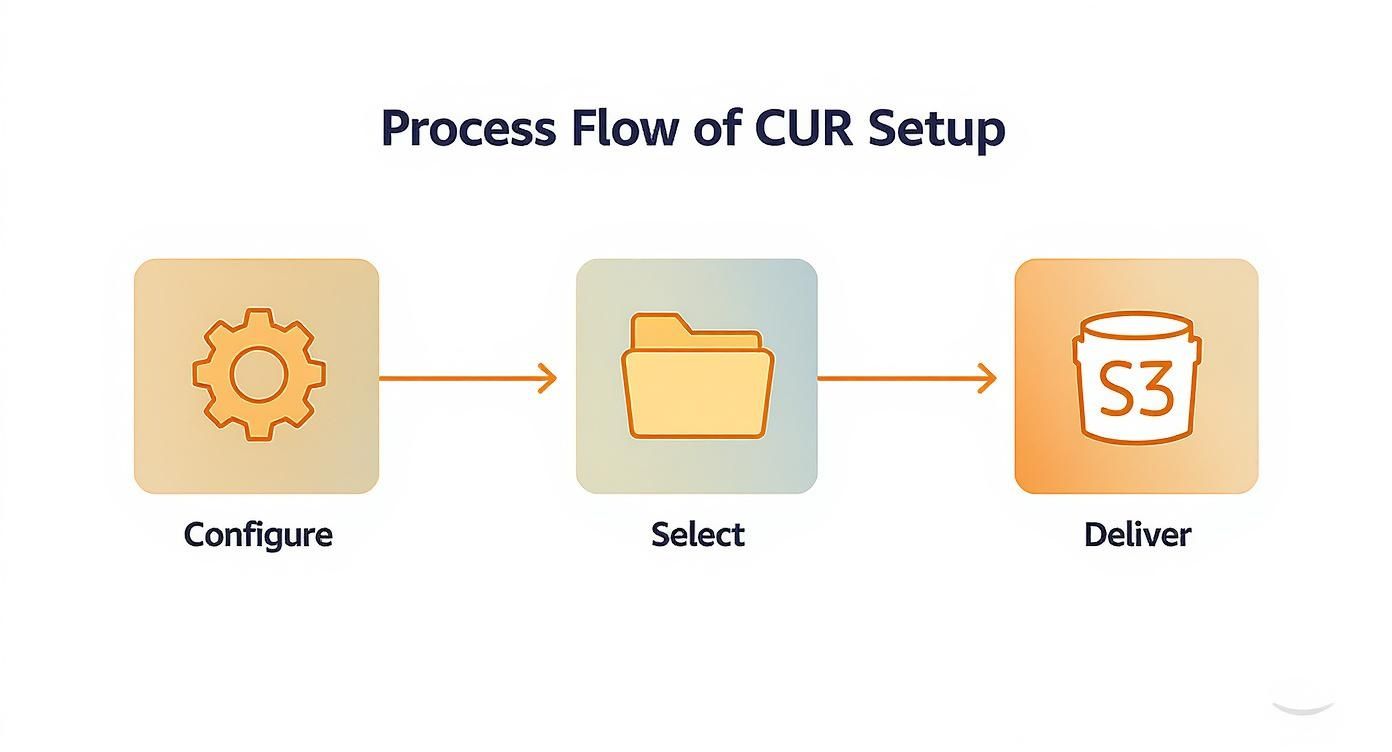
This workflow highlights the simple but powerful path from configuring your CUR to delivering it to S3, where the real analysis can begin.
H3: Practical Athena Queries for Cost Insights
The real magic of Athena is its ability to answer specific, practical business questions. By querying your CUR, you can hunt down waste, check for tagging compliance, and get a crystal-clear picture of your spending patterns.
Here are a couple of example queries to get you started:
-
Find Your Top 10 Most Expensive S3 Buckets
This helps you quickly spot which buckets are driving the most cost, which could indicate a need for lifecycle policies or storage tier adjustments.
-
Identify Untagged EC2 Instances
Untagged resources are a FinOps nightmare. They're nearly impossible to allocate to the right team or project, leading to "mystery" costs. This query finds them so you can get them tagged properly.
These queries are just the beginning. You can build reports for almost any cost-related question you can think of, from tracking Savings Plans coverage to pinpointing data transfer costs between regions. Getting a solid handle on your spending is foundational to smart cloud financial management. For more strategies, check out our complete guide on managing AWS costs.
With Athena, financial teams and engineers can finally speak the same language: data. An engineer can instantly check the cost impact of a new feature, while a finance manager can track budget adherence for a project, all from the same source of truth.
Comparing AWS Services for CUR Analysis
While the Glue, Athena, and QuickSight stack is a popular and powerful choice, AWS offers other tools that might be a better fit depending on your specific needs, data volume, and technical expertise.
| Service | Primary Use Case | Query Language | Best For |
|---|---|---|---|
| Amazon Athena | Ad-hoc, interactive SQL queries on data in S3. | Standard SQL | Teams comfortable with SQL who need fast, serverless analysis without managing infrastructure. Great for exploration and specific questions. |
| Amazon Redshift | Data warehousing and complex analytics on large, structured datasets. | PostgreSQL-based SQL | Organizations needing high-performance, complex queries, and joins across multiple large datasets. Best for enterprise-level BI. |
| Amazon QuickSight | Business intelligence (BI) and data visualization. | Visual (drag-and-drop) | Creating interactive dashboards and reports for business stakeholders. Excellent for visualizing trends and sharing insights with non-technical users. |
Choosing the right tool depends entirely on your goal. For quick answers and deep dives into raw data, Athena is king. For building a long-term, high-performance data warehouse, Redshift is the heavyweight champion. And for turning data into stories, QuickSight is your go-to visualizer.
H3: Visualizing Insights with Amazon QuickSight
SQL queries are fantastic for digging up answers, but dashboards are what you need to track trends and share insights with the rest of the company. That’s where Amazon QuickSight shines.
QuickSight is a business intelligence (BI) tool that connects directly to Athena as a data source. You can build interactive, drag-and-drop dashboards to visualize your CUR data without writing a single extra line of code.
With QuickSight, you can:
- Connect directly to your Athena table.
- Create visuals like bar charts, pie charts, and trend lines.
- Filter your data by tags, services, accounts, or time periods.
- Schedule automated email reports for stakeholders.
This is the final piece of the puzzle. It closes the loop, turning those raw, intimidating CUR files into professional, shareable dashboards. These visuals make it easy for everyone, from the C-suite to individual developers, to understand their financial impact and help build a culture of cost awareness.
Applying FinOps Principles with CUR Data
Getting your AWS Cost and Usage Report delivered to an S3 bucket is a solid first step. But the real magic happens when you use that data to drive financial accountability across your organization. This is where the CUR stops being just a report and becomes the engine for your FinOps practice, turning raw numbers into real, measurable savings. It's the bridge between seeing your costs and actually controlling them.
The whole point is to turn those insights into action. By applying FinOps principles, you can flip the script from being reactive about your cloud bill to being proactive. It’s about getting every team to understand and own their piece of the pie, which is the cornerstone of building a cost-aware culture.

Mastering Cost Allocation with Tagging
Let's be blunt: you can't manage what you can't measure. And you definitely can't measure costs you can't allocate. That's why a disciplined tagging strategy isn't just a nice-to-have; it's completely non-negotiable for anyone serious about cloud financial management.
Tags are just simple key-value pairs you attach to your AWS resources, like project:phoenix or team:backend-devs. But when these tags show up as columns in your AWS Cost and Usage Report, they become superpowers. Suddenly, you can slice and dice your spending with incredible precision. You can finally get straight answers to questions like, "How much is the marketing team's new campaign really costing us?" or "What's the cloud spend for our dev environment this month?"
A solid tagging strategy needs three things:
- Standardization: Decide on a mandatory set of tags that every single new resource must have. Think project, team, environment (e.g., prod, dev, staging), and cost center. Make it the law.
- Enforcement: Don't just hope people follow the rules. Use tools like AWS Service Control Policies (SCPs) or AWS Config to automatically enforce your tagging policy. This stops those untagged, "mystery" resources from ever being created in the first place.
- Verification: Things slip through the cracks. Regularly run queries against your CUR data to hunt down resources that are missing tags or have the wrong ones. This keeps your cost allocation data clean and trustworthy over time.
Once you have this foundation, you can build accurate showback or chargeback models, making teams directly accountable for the resources they use. This kind of visibility is a huge part of FinOps, a discipline you can learn more about in our detailed guide on what is FinOps.
Optimizing Your Largest Expense: Compute Costs
For most companies, compute services like Amazon EC2, AWS Lambda, and AWS Fargate make up the biggest chunk of the AWS bill. This makes compute optimization the single most impactful place to look for savings. It’s the low-hanging fruit, and there’s a lot of it.
In fact, one analysis of $3 billion in AWS spend found that compute costs make up about 53% of total spending even after discounts. That suggests that before discounts, compute can easily eat up 60% or more of the entire bill, making it the best target for cost-cutting. You can read the full analysis on compute spending trends for a deeper dive.
The hourly granularity of the CUR is your best friend here. By digging into usage patterns, you can spot waste and find some huge optimization opportunities.
The AWS Cost and Usage Report doesn't just tell you what you spent; it tells you how you spent it. This detailed narrative allows you to identify wasteful patterns, like running non-production servers 24/7 when they're only needed for eight hours a day.
Here are the most common plays for optimizing compute:
- Right-Sizing Instances: Use data from Amazon CloudWatch (which you can correlate with your CUR data) to find overprovisioned instances. Is that server really using all that CPU and memory? Moving a resource from a
c5.2xlargeto ac5.xlargecan cut its cost in half without anyone noticing a performance drop. - Shutting Down Idle Resources: The CUR shows costs piling up hour by hour. This makes it painfully obvious when non-production environments (dev, test, staging) are left running overnight and on weekends, just burning cash for no good reason.
- Maximizing Commitments: Your report breaks down your usage of Savings Plans and Reserved Instances (RIs). You can analyze this data to see if your commitments are being fully used. If not, you might have an opportunity to buy more to cover your steady-state workloads, which will dramatically slash your on-demand spend.
By systematically applying these FinOps principles, your AWS Cost and Usage Report changes from a boring billing file into a strategic weapon for driving efficiency and financial discipline across your entire company.
Measuring Savings from Cost Automation
So, you've set up automation to shut down idle resources. That’s a great first step. But how do you actually prove it's working and saving you money? Without hard data, your cost-saving efforts are just a good idea. This is exactly where the AWS Cost and Usage Report shines because it's your best tool for validating savings and building a rock-solid business case.
The secret is a simple but powerful 'before and after' analysis. Using your historical CUR data, you can paint a clear financial picture of what your resources cost before you flicked the switch on your automation. That picture becomes your baseline, the undeniable cost of doing nothing.
Establishing a Cost Baseline
First things first, you need to isolate the costs of the specific resources you’re targeting. This is where a consistent tagging strategy really pays off. Let's say you're going after development environments to shut them down after hours. A quick query in Athena can pinpoint every single cost associated with a specific tag.
Imagine you’ve tagged all your development resources with environment:dev. You can run a query against your CUR data from the last few weeks to calculate the total daily or weekly cost for everything carrying that tag. That number is your baseline. It's a concrete figure representing your pre-automation spend.
This baseline is your single source of truth. It instantly changes the conversation from "I think we're wasting money on dev servers" to "We are spending exactly $X per week on dev servers that are running 24/7."
Tracking Post-Automation Impact
With your baseline set, you can go ahead and implement your automation tool, like a scheduler that powers down all environment:dev instances outside of business hours. Let it run for a while, maybe a week or a month, to gather enough data. Then, run the exact same query against your new CUR data.
The difference between your baseline cost and your new, lower cost is your quantifiable savings. It’s no longer a guess; it's a hard number you can confidently take to your leadership team. This data-driven approach demonstrates the direct financial return on your optimization efforts, making it much easier to justify further investment.
A Practical Athena Query Example
To see this in action, you can use a straightforward SQL query in Amazon Athena to isolate costs based on a specific tag. This makes it incredibly clear how much you're saving by shutting down those dev environments overnight.
Here’s a simple conceptual query to get you started on measuring the costs for your dev environment:
SELECT
line_item_usage_start_date,
SUM(line_item_unblended_cost) AS daily_cost
FROM
"your_cur_database"."your_cur_table"
WHERE
resource_tags_user_environment = 'dev'
AND line_item_usage_start_date BETWEEN 'YYYY-MM-DD' AND 'YYYY-MM-DD'
GROUP BY
line_item_usage_start_date
ORDER BY
line_item_usage_start_date;
By running this query for the period before and after you turned on your automation, you can generate a clear, data-backed report showing the cost reduction. This simple method transforms your CUR from just another billing file into a powerful tool for measuring the success of various cloud cost optimization strategies and making smarter financial decisions.
Why the CUR Is a Strategic Business Asset
It's easy to look at the AWS Cost and Usage Report as just another billing file, a glorified spreadsheet for the finance team. But that’s like seeing a map as just a piece of paper. In reality, the CUR is one of the most powerful strategic assets you have for navigating the complexities of cloud finance and driving real business growth.
Mastering this report gives your organization a serious competitive advantage by drawing a clear line from granular, line-item costs all the way up to high-level business goals.
This level of detail is becoming non-negotiable as more businesses go all-in on AWS. The platform's dominance is undeniable. By 2025, AWS is projected to hold a 30% share of the global cloud infrastructure market, serving over 4.19 million customers. That customer base has exploded by 357% since 2020, driven by a massive influx of startups and SMBs. You can get the full picture in this in-depth AWS market report.
Fostering a Culture of Accountability
The CUR is the bedrock for building a culture of cost accountability. When your engineering teams can see the direct financial impact of their architectural choices, they start thinking less like coders and more like business owners. The conversation naturally shifts from, "Does it work?" to "Does it work efficiently?"
This simple change creates an environment where cost becomes a shared responsibility, not just a problem for finance to solve after the fact. Teams get proactive about optimization, which leads to more sustainable, profitable innovation.
By understanding precisely where every cloud dollar is going, you can innovate with confidence. The AWS Cost and Usage Report ensures your cloud investment directly supports your company's growth trajectory, turning spend into a strategic enabler rather than an uncontrollable expense.
Making Smarter Business Decisions
Ultimately, the rich data inside the CUR empowers smarter, data-driven decisions across the entire organization. It gives you the power to:
- Improve Budget Forecasting: Forget rough estimates. You can now build precise financial plans based on actual historical usage patterns.
- Optimize Architecture: Easily spot costly services or inefficient designs that are ripe for re-engineering, improving both performance and your bottom line.
- Validate Initiatives: Use the report to prove the ROI of cost-saving measures, making it easy to justify further investment in optimization tools and best practices.
The CUR transforms your cloud spend from a mysterious operational cost into a well-understood investment, perfectly aligning your technical execution with your strategic financial goals.
Frequently Asked Questions
Even with a comprehensive guide, a few common questions always pop up when you start digging into the AWS Cost and Usage Report. Let's tackle some of the most frequent ones to clear up any confusion between AWS tools and the report's lifecycle.
What Is the Difference Between the CUR and Cost Explorer?
Think of AWS Cost Explorer as the dashboard in your car. It gives you a quick, visual overview of your speed and fuel level, perfect for at-a-glance checks and spotting high-level spending trends. It's a fantastic, user-friendly visualization tool.
The AWS Cost and Usage Report, on the other hand, is the engine's raw telemetry data. It's the incredibly detailed, line-by-line log of every single event. CUR is the foundational data source that actually feeds Cost Explorer, and it's what you need for deep, custom analysis, programmatic processing, or building your own bespoke cost allocation systems.
How Often Is the AWS Cost and Usage Report Updated?
AWS drops updated report files into your designated S3 bucket at least once a day. If you need more timely data, you can configure your report to update up to three times a day. This helps the data reflect recent usage, though you should still expect a lag of several hours.
It's crucial to remember that at the end of the month, AWS generates a final, reconciled version of the report after your official invoice is locked in. This final version is the definitive source of truth for that billing period.
Is There a Cost for Using the CUR?
There's no direct charge for generating the AWS Cost and Usage Report itself. The service of creating the report is free.
However, you are on the hook for the costs of the services you use to store and analyze it. These costs almost always include:
- Amazon S3 Storage: You'll pay standard S3 storage rates for the report files that land in your bucket. As these reports accumulate, this can add up.
- Analysis Services: If you use tools like Amazon Athena, AWS Glue, or Amazon QuickSight to query and visualize the data, you will be charged for those services based on their own pricing models, like paying per query or per user.
So, while the report data itself is free, the infrastructure needed to actually make sense of it is not.
Ready to turn insights from your aws cost and usage report into real savings? CLOUD TOGGLE makes it easy to automate shutting down idle non-production servers, a proven strategy for drastically cutting your AWS bill. Stop paying for resources you aren't using and start saving with our 30-day free trial. Learn more at https://cloudtoggle.com.