Calculating your percentage savings is pretty straightforward. You just subtract the new, lower price from the original price, divide that number by the original price, and then multiply the whole thing by 100.
The formula looks like this: (Original Price – New Price) / Original Price x 100. This simple calculation gives you a clear percentage that shows exactly how much you've saved.
Understanding What Percentage Savings Really Means
Before you start plugging numbers into a calculator, it's worth taking a moment to appreciate what this metric actually tells you. Percentage savings isn't just a number; it’s a universal yardstick for efficiency that works for everything, from your personal grocery budget to large-scale FinOps at a tech company. It translates a raw dollar amount into a relative value, making it much easier to compare the real impact of different cost-cutting efforts.
For example, saving a specific dollar amount is an absolute saving, but the percentage gives you the relative saving. This difference is critical. Saving $100 on a $1,000 cloud bill is a 10% savings, which is pretty significant. But saving that same $100 on a massive $10,000 bill? That's only a 1% savings. The percentage immediately puts the achievement into context.
Why Relative Savings Matters Most
Grasping the relative impact of your actions is key to making smarter decisions. In business, it helps you prioritize what to work on next. A project that saves 20% on a smaller budget might be more impressive and easier to replicate elsewhere than one that shaves just 2% off a massive budget. This perspective is vital when you're trying to manage cloud costs, where you need to distinguish between fixed and variable costs to find real optimization opportunities.
This way of measuring is a fundamental financial skill used everywhere. Think about retail sales. The formula is often expressed as (Savings Amount / Original Price) × 100%. If you buy a shirt originally priced at $50 for $40, your savings amount is $10. Divide $10 by $50 to get 0.2, multiply by 100, and you've got a 20% savings. This is the exact same logic we’ll apply to calculating the impact of your cloud cost strategies in the examples later.
The real power of percentage savings is its ability to standardize how you measure success. It creates a common language for engineers, FinOps pros, and finance teams to talk about the impact of optimizations, no matter the absolute dollars involved.
For a quick reference, here's a simple breakdown of the formula and its parts.
The Percentage Savings Formula At A Glance
Use this quick reference to understand the core components of the percentage savings calculation.
| Component | Description | Example Value |
|---|---|---|
| Original Price | The cost before any changes or optimizations were made. | $1,000 |
| New Price | The cost after the changes have been implemented. | $800 |
| Savings Amount | The absolute dollar difference (Original – New). | $200 |
| Percentage Savings | The relative savings expressed as a percentage. | 20% |
Understanding this is the first real step toward accurately measuring and communicating the value you're delivering through your optimization efforts.
A Practical Method For Calculating Cloud Cost Savings
Talking theory is one thing, but putting it into practice is where you see the real money. So, let's walk through a common scenario for figuring out your cloud savings, taking it from an abstract idea to concrete steps you can use in your own work.
The whole process boils down to getting a clear "before" and "after" picture of your spending.
First things first: you need a reliable baseline cost. This is your starting point, what you were spending before you made any changes. A classic example is calculating the total daily spend on a fleet of EC2 instances you've targeted for optimization. Just grabbing one day's cost can be tricky because of normal traffic swings, so I always recommend averaging the cost over a week, or even 30 days, to get a much more accurate baseline.
Once your baseline is solid and you’ve rolled out a change, like rightsizing those instances or applying new Savings Plans, you need to measure the new, lower cost. Just like with the baseline, it's best to let this run for a consistent period to get a good, clean reading. Now you have the two numbers that matter.
This simple flow shows how you get from your original price to the final percentage savings.
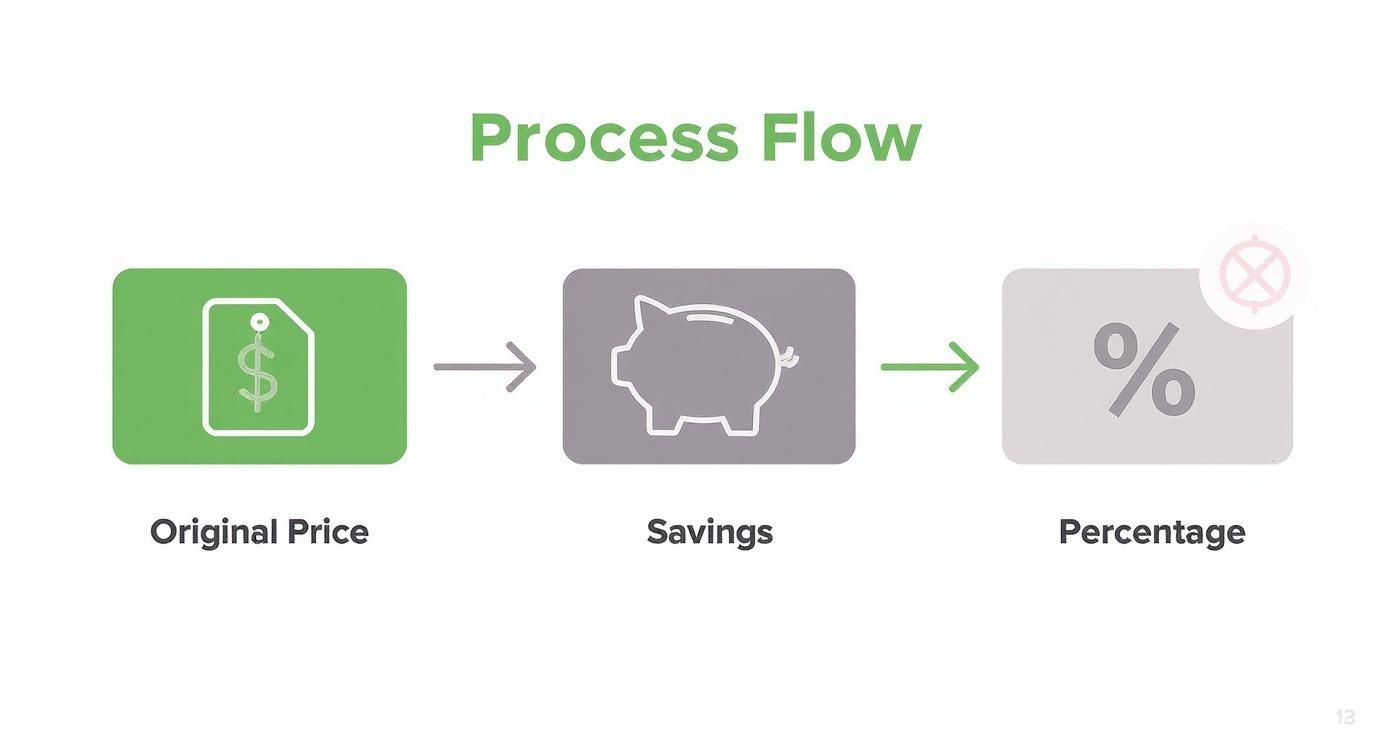
As you can see, it’s a three-part journey: identify the initial cost, figure out the raw savings, and then convert that into a percentage that everyone can understand.
Putting The Formula To Work
With your two cost figures ready, you can plug them into the percentage savings formula to turn your hard work into a clear, compelling metric. The formula is simply ((Original Cost – New Cost) / Original Cost) * 100. This calculation is the foundation for showing the impact of any optimization you do.
Let's use a real-world example to see it in action.
- Original Cost: Your team was spending $250 per day on a group of underused virtual machines. This is your baseline.
- New Cost: After you implemented a scheduling solution to power them down overnight, the daily cost dropped to $150.
- Savings: The absolute dollar savings is $250 – $150 = $100 per day.
Now, we just pop these numbers into the formula: (($250 - $150) / $250) * 100.
This simplifies down to ($100 / $250) * 100, which is 0.4 * 100. The result is a 40% savings.
This single percentage is incredibly powerful. It instantly communicates the effectiveness of your initiative to both technical and non-technical stakeholders, proving the value of your efforts in a universally understood format.
This method isn't just for one-off projects; it’s the core of continuous improvement in FinOps. If you're looking to go deeper, our complete guide on what is cloud cost optimization offers more strategies and insights.
The key is to be consistent in how you measure. Make sure your baselines are fair representations of typical usage, not just weird outliers. When you do that, you build trust in your data and can clearly show the return on your optimization investments.
Applying The Formula In The Real World
https://www.youtube.com/embed/wDwgw3Da7O4
That basic savings formula is a solid starting point, but let's be honest, real-world cloud environments are anything but simple. Costs bounce around, user traffic spikes, and multiple teams are pushing updates all at once. So, let's walk through a couple of common, messy scenarios that FinOps pros and engineers deal with every day to see how this calculation holds up.
Picture this: your team just flipped on a new feature toggle using CLOUD TOGGLE. The goal is to dynamically scale down a VM cluster during off-peak hours, which should save a good chunk of change. But, the day after you enable it, the marketing team launches a campaign that sends a flood of unexpected traffic.
Now what? How do you separate the savings from the toggle from the cost increase caused by the traffic surge?
This is exactly why having a trustworthy baseline is non-negotiable. Forget comparing Monday's bill to Tuesday's. You need to look at the average hourly cost for that specific cluster over a longer period, like the previous 14 or 30 days. This extended baseline smooths out the daily noise and gives you a far more accurate "before" snapshot.
Case Study: Isolating A Feature Toggle's True Impact
Let’s put some real numbers on this. The mission is to prove the new auto-scaling feature is working, even with all the other chaos.
First, we need to nail down the baseline cost for that VM cluster before anything changed.
- Baseline Period: The 14 days right before the feature toggle was enabled.
- Average Hourly Cost (Baseline): You dig into your billing data and find the cluster cost an average of $12.50 per hour.
Next, you measure the cost after the change went live, but you have to be careful to normalize the data to make a fair comparison.
- Measurement Period: The 14 days immediately following the feature toggle being enabled.
- Average Hourly Cost (New): With the new scaling policy active, the new average hourly cost drops to $9.00.
Now you can confidently calculate the savings that are directly tied to your toggle. The formula itself doesn't change, but the quality of your inputs makes all the difference.
((12.50 - 9.00) / 12.50) * 100 = 28%
Boom. You can now prove a 28% cost reduction on that workload. It's a real number that accurately reflects your feature's impact, completely independent of that marketing campaign's traffic spike. This kind of detailed analysis is essential for truly understanding the hidden cost of idle VMs and the tools that help solve the problem.
By comparing apples to apples, average hourly cost before versus average hourly cost after, you effectively filter out the noise from unrelated events. This method ensures your reported savings are credible and can stand up to scrutiny from finance or leadership.
Calculating Savings In CI/CD Pipelines
CI/CD pipelines are another goldmine for optimization. Here, savings aren't just about compute costs; they're also about winning back precious developer hours. Let's say your team's pipeline used to take an average of 25 minutes to run a build, burning through expensive, high-CPU runners. After a bit of tuning by optimizing a few build steps and adding dependency caching, the average build time drops to just 15 minutes.
Here’s how you’d calculate the percentage savings in both time and money.
1. Time Savings First:
This one's straightforward.
- Original Time: 25 minutes
- New Time: 15 minutes
- Calculation:
((25 - 15) / 25) * 100 = 40%
You’ve just slashed your pipeline execution time by 40%. That’s a huge win for developer productivity.
2. Now, The Cost Savings:
Let's translate that time into dollars.
- Original Cost: Assume the runner costs $0.08 per minute. The original cost per build was
25 * 0.08 = $2.00. - New Cost: The new, faster build now only costs
15 * 0.08 = $1.20. - Calculation:
((2.00 - 1.20) / 2.00) * 100 = 40%
The result is a 40% direct cost saving on compute for every single build that runs.
These examples really drive home the point: the key to calculating percentage savings in complex situations is to first isolate the right metric, whether that’s average hourly cost, pipeline duration, or something else entirely, before you plug the numbers into the formula.
How To Project And Communicate Your Savings
Calculating a one-time saving is a great start, but the real power comes from showing what that impact looks like over the long haul. A single number is easy to dismiss. Projecting your savings across a month or an entire year? That's what grabs the attention of stakeholders and turns a small win into a significant strategic contribution.
Of course, extrapolating savings isn't just about multiplying a daily number by 30 or 365. You have to think bigger and account for the variables that can throw a wrench in your forecast. For instance, consider seasonality. A cost-saving measure on a retail platform might show huge returns during the holiday rush but have less impact during a slower quarter. Business growth can also move the goalposts, as increased usage might eat into the percentage savings you've achieved.

This kind of detailed projection is a core function in business operations. In procurement, for example, calculating percentage savings is fundamental. A 2021 report found that global procurement teams achieved an average cost savings of 12% through strategic initiatives, proving just how valuable precise reporting can be. You can discover more insights about strategic savings tracking from the full report.
Tailoring Your Message To The Audience
Once you have your numbers locked in, how you talk about them is just as important as the math itself. The story you tell needs to change depending on who's in the room.
For an engineering team, frame the results around efficiency and performance.
- Talk about metrics they care about, like reduced CI/CD pipeline wait times.
- Emphasize lower resource contention or faster deployment cycles.
- Connect the dots between the savings and improved developer productivity.
For the finance team or leadership, the conversation needs to be all about the bottom line.
- Present the total projected monthly and annual savings in clear, hard currency.
- Show how the percentage impacts the overall cloud budget.
- Frame the savings as a direct contribution to the company's profitability or margin improvement.
Communicating savings effectively means speaking the language of your audience. Engineers value technical efficiency, while finance leaders respond to financial impact. A successful report bridges that gap and shows how one directly leads to the other.
Percentage Points Vs. Percentage Change
One final, critical point on communication: you absolutely must know the difference between percentage points and percentage change. Getting this wrong can seriously undermine your credibility.
Let's break it down.
- Percentage Change (or Savings): This is the relative reduction we've been calculating all along. If costs fall from $100 to $80, the percentage saving is 20%.
- Percentage Points: This describes the simple arithmetic difference between two percentages. If your cloud spend was 10% of total revenue and you got it down to 8%, your spending improved by 2 percentage points.
It would be flat-out wrong to say you achieved a "2% saving" in that scenario. The actual percentage saving on that metric is 20% ((10 - 8) / 10 * 100). Using the correct terminology ensures your reporting is always clear, accurate, and professional. No ambiguity, no confusion.
Common Mistakes That Invalidate Your Savings Data
Nothing torpedoes your credibility faster than presenting savings data that doesn’t hold up under scrutiny. When you’re calculating percentage savings, even small errors can lead to wildly misleading figures. Getting this right is absolutely essential for building trust with both your engineering and finance stakeholders.
The most common and damaging mistake is using an inconsistent or cherry-picked baseline. It’s tempting to compare your new, lower cost against the single most expensive day from the previous month. Sure, it’ll make your percentage savings look amazing, but it's fundamentally dishonest and easily disproven.

Similarly, failing to account for seasonality or natural business cycles can wreck your numbers. If you roll out a change during a slow month, your savings will look inflated compared to a peak month. The fix is simple: always use an average from a representative period, like the preceding 30 days, to establish a baseline that's both fair and defensible.
Wrongly Attributing External Factors
Another major pitfall is taking credit for savings you didn't actually create. Let's say you rightsize a fleet of VMs and proudly report a 15% cost reduction. At the same time, though, your cloud provider announced a 10% price cut for that very instance family. In reality, your direct action only contributed to a 5% saving.
To avoid this, you've got to check for external factors that could influence costs during your measurement period. This includes things like:
- Vendor Price Drops: Publicly announced price reductions from providers like AWS or Azure.
- New Reserved Instances or Savings Plans: Large, centralized purchases made by a FinOps team that affect your resource costs.
- Changes in Data Transfer Costs: Fluctuations in network pricing that are completely outside your team's control.
Failing to isolate your specific impact makes it impossible to know if your optimization strategy was truly effective or just happened to coincide with a lucky break.
Your goal is to prove the impact of your actions, not just report a drop in the bill. By proactively identifying and subtracting the effects of external events, you demonstrate analytical rigor and build genuine confidence in your results.
Forgetting One-Time Implementation Costs
Finally, it's all too easy to focus on the recurring operational savings while completely ignoring the upfront costs of implementation. Did your team spend 40 engineering hours developing the automation script that powers down idle servers? That's a significant one-time cost that eats directly into your net savings.
Always factor in the "cost to save" when you report your overall impact. A true financial analysis has to include both the initial investment and the ongoing return. A project that saves $500 a month but cost $10,000 in developer time has a 20-month payback period. Acknowledging this provides the complete picture and helps stakeholders make much better decisions about which optimization projects to tackle next.
Answering Common Questions
Even with a solid formula, a few tricky questions always come up when you start applying these calculations in the real world. Let's tackle some of the most common ones we hear from both FinOps and engineering teams to clear up the nuances that can make or break your analysis.
How Do I Calculate Percentage Savings If The Original Cost Changes?
This is a big one. When your baseline cost fluctuates, you need a consistent way to measure, or your numbers will be all over the place.
The best practice is to define a "baseline period." A great starting point is the average daily cost over the 30 days before you flipped the switch on your change. Then, you compare that to the average daily cost for the 30 days after the change.
This "before and after" snapshot is crucial. It smooths out the natural peaks and valleys in usage and spending, giving you a much more honest picture. Whatever you do, avoid the temptation to cherry-pick a single, unusually expensive day as your baseline. It might make your savings percentage look amazing, but it will instantly damage your credibility with anyone who looks closely at the data. A consistent, averaged baseline is always the most defensible approach.
What Is The Difference Between Percentage Savings And Percentage Points?
Getting this right is absolutely vital for clear communication, especially when talking to finance or leadership. Mixing these up is a common mistake that can lead to major confusion and undermine the trust in your reporting.
Let's break it down:
- Percentage Savings: This is the relative drop in cost. If your cloud bill went from $100 down to $80, you’ve achieved 20% savings. It shows how much smaller the new cost is in relation to the original.
- Percentage Points: This term is only used to describe the simple difference between two percentages. For instance, if your cloud spend was 10% of total revenue, and you got it down to 8%, your spending has improved by 2 percentage points.
If you said you saved 2% in that second scenario, you'd be wrong and unintentionally misleading. The actual percentage saving on that metric is ((10 - 8) / 10) * 100, which is a 20% improvement. Using the right term is a hallmark of professional financial reporting.
Can I Automate Percentage Savings Calculations?
Yes, and you absolutely should for any kind of ongoing tracking. Manually pulling reports is a recipe for errors and wasted time. Automation gives you consistency and, more importantly, real-time visibility into how your optimizations are performing.
You can set up dashboards in tools like Grafana or Datadog, or even directly in your cloud provider's console, to track costs for specifically tagged resources. For something more custom, you can use spreadsheet formulas in Excel or Google Sheets that automatically pull cost data through APIs or from scheduled data exports.
For more advanced teams, the gold standard is integrating cost calculation scripts directly into your CI/CD pipelines. This lets you measure the financial impact of every single deployment, which is incredibly powerful.
Ready to stop paying for idle cloud resources? CLOUD TOGGLE makes it simple to schedule your servers and VMs to power down when they’re not in use, delivering predictable and scalable savings with minimal setup. Start your free 30-day trial and see how much you can save at https://cloudtoggle.com.