A lot of teams meet BigQuery the same way. They load data fast, run a handful of queries, build a dashboard, and assume the bill will stay small because they aren't managing servers.
Then the invoice lands, and it doesn't look like a storage problem. It looks like somebody left an expensive analytics engine running without guardrails.
That reaction is understandable. BigQuery is one of the easiest ways to get a warehouse online, but it also makes spend feel deceptively abstract. You don't buy nodes up front like older MPP systems. You buy outcomes through storage, query processing, and ingestion. That flexibility is great for delivery speed. It's also why google bigquery costs can swing hard when teams treat query execution like a free operation.
Decoding Your First Surprise BigQuery Bill
The usual pattern is simple. An analyst explores a large table. Someone opens Looker Studio. A developer tests a transformation repeatedly. Nobody thinks they're doing anything reckless.
But BigQuery doesn't care whether a query was exploratory, accidental, or part of a production pipeline. It bills based on how the platform reads and processes data. That's why a bill can jump before your team feels like usage has grown in any meaningful way.

For AWS and Azure operators, the mental model is closer to serverless compute than reserved infrastructure. You aren't paying to keep a cluster alive. You're paying every time work gets done. That sounds efficient, and often is, but usage-based systems punish loose habits faster than fixed systems. If your team already tracks the real cost of cloud infrastructure, BigQuery should sit in the same category of spend that needs policy, attribution, and active review.
BigQuery rarely becomes expensive because storage quietly grew. It becomes expensive because people asked expensive questions of large tables.
The upside is that bill shock in BigQuery is usually diagnosable. The bill isn't random. It reflects a small set of technical choices: how data is stored, how queries are written, how often jobs rerun, and whether anyone put limits in place.
That makes BigQuery spend controllable. You just need the right model for reading the bill.
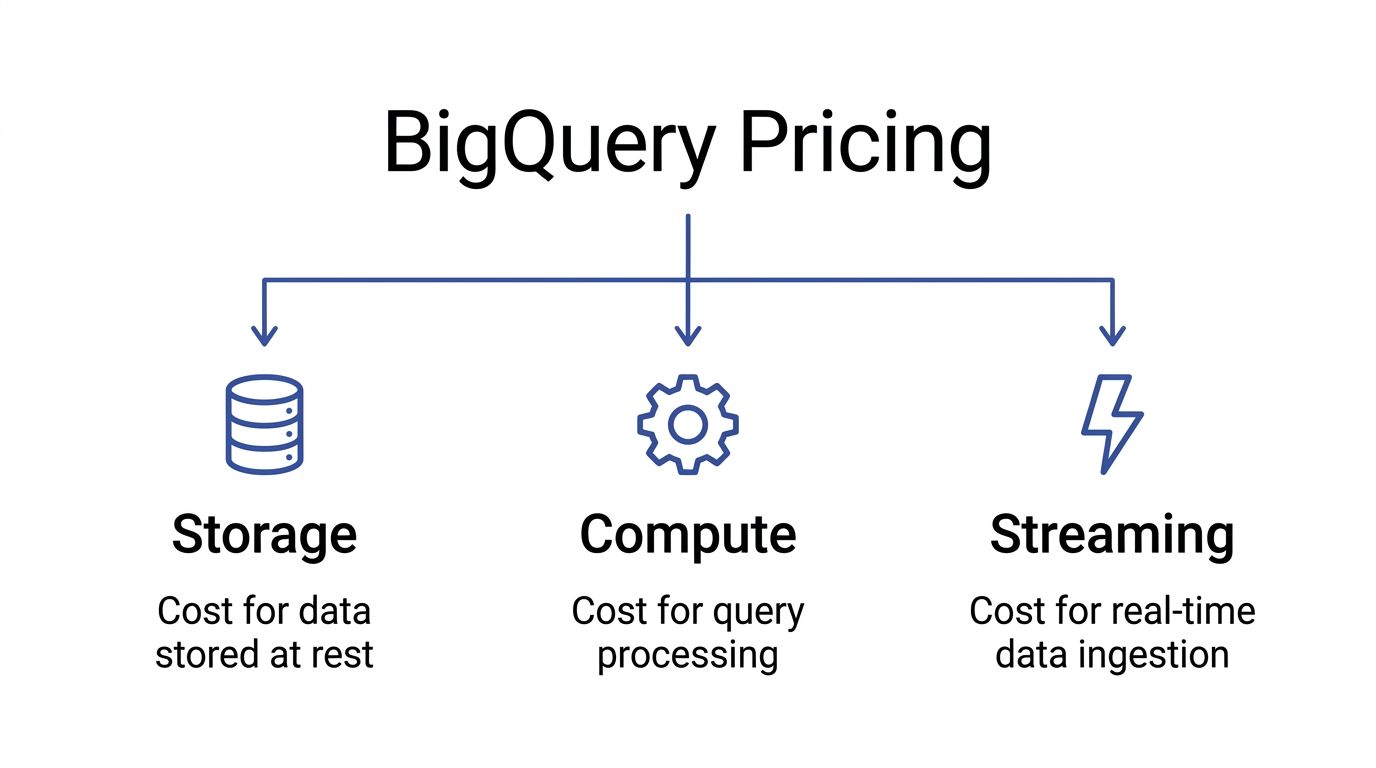
The Three Pillars of BigQuery Pricing
A useful BigQuery bill breakdown starts with three separate cost buckets: storage, query processing, and streaming ingestion. SMB teams usually overspend on the second and sometimes on the third. Storage gets attention because it is easy to understand. Compute and ingestion are where small design choices turn into recurring spend.
Storage costs are predictable, but they still affect design
BigQuery storage pricing is straightforward compared with query billing. You pay to keep table data at rest, and older unmodified data typically becomes cheaper over time. For FinOps teams, the practical takeaway is simple: storage is rarely the source of sudden bill spikes, but retention policy, partitioning, and table duplication still affect your monthly floor.
That matters for SMBs because "cheap storage" often leads to sloppy habits. Teams keep raw, cleaned, and transformed copies of the same dataset without a retention rule. The unit price may stay low, but duplicate pipelines and unnecessary replicas subtly raise baseline cost.
For AWS and Azure users, this is closer to object storage economics than always-on warehouse infrastructure. The bill grows with volume, not with provisioned nodes. If you are comparing warehouse spend against broader Google Cloud pricing across services, storage usually behaves like the stable part of the bill.
Compute is the cost center that deserves weekly review
BigQuery compute charges come from the work your queries do. Consequently, DevOps and analytics engineering decisions hit the budget directly. A dashboard that scans a wide table every few minutes can cost more than storing that same table for months.
The common trap is focusing on table size instead of bytes processed. BigQuery often charges based on how much data a query reads, not how much data it returns. A query that outputs 10 rows can still scan hundreds of gigabytes. That is the referenced data problem many teams miss at first, especially when they assume filters or LIMIT clauses automatically make a query cheap.
A practical rule helps here: treat every repeated scan like an API call with a price tag. Scheduled reports, BI refreshes, retrying failed jobs, and analyst exploration all stack up. In an SMB environment without query guardrails, compute becomes the line item that breaks predictability first.
Storage sets your baseline. Compute determines whether your baseline stays under control.
Streaming ingestion buys freshness at a premium
Streaming is billed separately from storage and query processing. The trade-off is operational, not just financial. You pay more for lower-latency ingestion, and you also take on more billing complexity.
Teams should ask a hard question before enabling streaming by default: does the business need data visible within seconds or minutes? If the answer is no, batch loading is often the better choice. It usually lowers cost and reduces troubleshooting noise across pipelines.
Here is the cost logic in plain terms:
| Cost pillar | What triggers it | Why teams choose it | What usually goes wrong |
|---|---|---|---|
| Storage | Keeping table data at rest | Retain history cheaply | Duplicate tables and weak retention policies raise the monthly floor |
| Compute | Query scans and processing work | Fast analytics without managing clusters | Wide scans, frequent refreshes, and rerun jobs drive most overspend |
| Streaming | Real-time row ingestion | Fresh operational reporting | Teams pay for immediacy they do not actually need |
This breakdown matters because each pillar has a different optimization path. Storage is a governance problem. Compute is a query and workload management problem. Streaming is an architecture decision. If a team treats all three the same, it usually cuts the cheapest line item first and leaves the expensive behavior untouched.
On-Demand vs Flat-Rate Pricing Models
A common SMB pattern goes like this. The team starts on BigQuery with a small monthly bill, then one heavier reporting cycle or a few poorly scoped dbt runs push query spend up fast. Finance asks whether flat-rate would have prevented it. Sometimes yes. Often no.
The decision is how you want to pay for compute risk.
On-demand works when usage is uneven
On-demand pricing charges by query data scanned. Google documents pricing on the BigQuery pricing page. For small teams, that model is usually the right default because it matches uncertain usage. You pay for actual activity instead of reserving capacity that may sit idle.
That is a good fit for early-stage analytics, ad hoc SQL work, periodic investigations, and environments where query volume changes week to week. It also makes waste visible. If an analyst scans a wide raw table five times in a day, the bill reflects it immediately.
That visibility is useful for FinOps. It is also unforgiving.
The trap is assuming on-demand is only expensive at scale. It can get expensive at low scale if query hygiene is poor, especially when teams repeatedly hit large partition ranges, query nested raw events directly, or get caught by BigQuery's referenced-data billing behavior in ways that are not obvious during development.
Capacity pricing buys a steadier bill, not automatic savings
Capacity pricing shifts the problem. Instead of paying per TiB scanned, you pay for slot capacity through editions and commitments. That gives better predictability, which matters if you run scheduled transformations, support steady BI concurrency, or need performance isolation for production workloads.
AWS and Azure teams usually understand this trade-off quickly. On-demand BigQuery behaves more like serverless analytics spend that rises with each workload spike. Capacity pricing behaves more like reserving compute for a cluster. The benefit is a steadier bill and fewer surprises during busy periods. The risk is underused capacity.
A reserved slot that sits idle is no different from an oversized node group or an underused Reserved Instance. Finance gets predictability, but not efficiency.
The break-even point depends on workload shape
The wrong way to choose is by company size or by edition name. The right way is to compare monthly scanned bytes, concurrency, and how consistent your daily workload really is.
Capacity starts to make sense when three conditions are true:
- Production queries run on a schedule every day
- Dashboard traffic and transformation jobs create steady concurrency
- The team can keep reserved slots busy for a meaningful share of the month
If those conditions are not true, on-demand is often cheaper even if one month looked ugly. A surprise bill usually points to query design, poor guardrails, or the wrong table layout before it points to the pricing model.
This is the part experienced teams still get wrong. They treat one expensive scan month as proof that flat-rate will save money. In practice, flat-rate only wins if the workload is consistent enough to use what you commit.
| Attribute | On-Demand Pricing | Flat-Rate (Capacity) Pricing |
|---|---|---|
| Billing basis | Bytes processed by queries | Reserved slot capacity |
| Best fit | Spiky usage, experimentation, smaller teams | Stable pipelines, recurring BI demand, higher concurrency |
| Budget behavior | Variable month to month | More predictable month to month |
| Main cost risk | Expensive scans and poor SQL discipline | Paying for idle or oversized commitments |
| Operational focus | Reduce bytes processed and control query access | Right-size slots and separate production from ad hoc work |
| Common SMB mistake | Letting analysts query raw tables freely | Buying capacity before utilization is steady |
Hybrid usage is often the practical answer
Many teams do not need a pure choice. Production workloads can justify reserved capacity, while ad hoc analysis stays on on-demand pricing. That split is often the cleanest option for DevOps and FinOps teams trying to protect dashboards and scheduled transformations without subsidizing unlimited exploration.
It also creates better accountability. Platform owners can budget for known workloads. Analysts still get flexibility, but the cost of exploratory behavior stays visible instead of being hidden inside a larger commitment.
What actually works
Choose the model that matches the shape of the workload, not the anxiety from the last invoice.
On-demand is usually the better fit for SMBs still shaping their warehouse, controlling analyst access, and learning which queries matter. Capacity pricing fits better once BigQuery starts behaving like a production service with predictable daily demand.
If the environment is still noisy, fix the waste first. Then decide whether committed capacity will stay busy.
Real-World BigQuery Cost Calculation Examples
A BigQuery bill usually goes sideways in a familiar way. Storage looks harmless during setup, then a few scheduled transforms, BI refreshes, and analyst queries hit the same raw tables over and over. The surprise is not the warehouse existing. The surprise is how fast repeated scans outrun storage.
Example one with a small analytics footprint
Start with a small company piping web analytics, CRM records, and ad platform exports into BigQuery. In that setup, storage is often the least important line item. Keeping a useful amount of history is usually affordable for an SMB.
Risk primarily appears in access patterns. If reports read narrow summary tables, monthly spend stays boring. If analysts query raw event tables for every question, the bill changes shape fast.
This is the first trap FinOps teams should flag. Cheap storage creates false confidence. Query behavior determines whether the environment stays cheap.
Example two with routine ETL and BI reporting
Now take a more typical operating model. Data lands every day, transformation jobs run on a schedule, and a dashboard layer serves sales, finance, or ops. In such scenarios, BigQuery often works well for SMBs because the warehouse can stay cost-efficient if each layer does its job.
A clean pattern looks like this:
- Raw ingestion tables receive batch loads
- Scheduled transformations build smaller curated tables
- BI tools read marts or aggregates, not raw history
- Ad hoc analysis is limited or routed through reviewed datasets
That setup gives DevOps and FinOps teams something close to a baseline monthly cost. It is similar to the difference between querying S3 data directly every time versus serving dashboards from pre-aggregated tables in Athena, Redshift, or Synapse. The storage bill is predictable. The scan bill depends on discipline.
The failure mode is common. A reporting team points dashboards at broad source tables, then adds more filters, more users, and shorter refresh intervals. The warehouse has not changed. The operating pattern has.
Teams working on optimizing cloud computing usually recognize this quickly. In BigQuery, waste often comes from repeated reads of the same large datasets rather than from keeping the data itself.
Example three with heavy analytical usage
At larger scale, BigQuery can still be financially reasonable, but the cost mix changes. Storage remains easier to predict than compute. What gets expensive is concurrency, experimentation, and re-reading large tables for notebooks, feature engineering, one-off investigations, and poorly scoped BI workloads.
I see this pattern most often when a company has done the hard part of centralizing data, but not the harder part of controlling how teams consume it. One data science workflow scans a large fact table. Then another team copies the pattern. Then scheduled jobs, dashboard refreshes, and ad hoc SQL all hit the same datasets from different directions.
That is where experienced teams still get caught by the referenced data trap. A query can look selective because the WHERE clause returns a small result set, while the underlying scan is still broad because the table design, partition filters, or join pattern force BigQuery to read far more data than expected. AWS users run into the same issue in Athena. Filtering output does not guarantee a small bill if the engine still has to scan the underlying data.
The financial signal matters. If spend rises because the business retained more data and runs more production reporting, that is normal. If spend rises because more people are repeatedly scanning the same raw tables, the warehouse is exposing a governance gap.
A practical way to estimate your own spend
Forecasting BigQuery costs gets easier when you estimate by workload behavior instead of headline storage volume.
How much raw data lands each day
This sets the floor for ingestion, storage growth, and downstream transformations.How many scheduled jobs touch that data
Daily ELT pipelines create a recurring compute baseline that is easier to budget.What tables do dashboards read
Dashboards pointed at curated marts behave very differently from dashboards pointed at raw events.How often do analysts run exploratory SQL
Interactive usage is usually where variance starts.Do queries prune data well or scan referenced tables broadly
This is the detail many estimates miss, and it is one of the fastest ways for an SMB bill to drift.
A good forecast looks less like a pricing calculator and more like an application capacity model. Count the workloads, identify who can trigger expensive scans, and estimate how often they do it. That gets much closer to the invoice your finance team will see.
Advanced Cost Optimization Strategies
A surprise BigQuery bill usually comes from repetition, not one dramatic query. An analyst reruns a heavy join during debugging. A dashboard refreshes against raw tables all day. A transformation rebuilds from scratch because nobody switched it to incremental. The pattern looks a lot like leaving an oversized EC2 instance running for convenience. Small choices pile up into a real monthly cost.

Cut scan width before you tune anything else
SELECT * is one of the fastest ways to waste money in BigQuery. Columnar systems charge for reading columns, so broad selects behave like overprovisioning CPU and memory for a service that only needs one core and a few gigabytes.
The fix is simple, but teams need to enforce it:
- Select only the columns the query uses
- Check BI-generated SQL, because dashboards often request more fields than the chart needs
- Review staging and notebook queries, where convenience usually wins over cost discipline
This matters most for SMB teams because a few careless habits can distort the whole warehouse bill. In larger environments, the waste gets diluted across more workloads. In smaller ones, it shows up on the invoice immediately.
Partition and cluster for actual access patterns
Partitioning and clustering only save money when they match how people query the data. Partition on the field that consistently narrows time. Cluster on columns that repeatedly filter or join well, such as customer_id, account_id, or region.
A practical setup looks like this:
| Tactic | Best fit | Cost effect |
|---|---|---|
| Partitioning | Tables filtered by date or timestamp | Avoids scanning irrelevant partitions |
| Clustering | Tables filtered by a few repeated dimensions | Reduces block reads inside partitions |
| Both together | Large fact tables with stable filter patterns | Cuts read volume further than either tactic alone |
The trade-off is operational. Good partition and cluster design takes planning, testing, and occasional rebuilds as query behavior changes. Bad design gives you the management overhead without much savings.
Materialize work that people keep redoing
BigQuery storage is cheap relative to repeated compute. If a team keeps recomputing the same expensive intermediate step, materializing that result is often the better financial choice.
This shows up in three places:
Development loops
Engineers rerun the same transformation while fixing logic.Scheduled pipelines
Full refresh jobs read far more data than the business changed.BI workloads
Dashboards hit complex joins that should have been pre-aggregated upstream.
For dbt, Dataform, and scheduled SQL, incremental models usually produce the clearest savings. They also improve predictability, which matters just as much as raw cost reduction. A FinOps program works best when engineering patterns make spend easier to forecast, not just lower. Teams building that discipline should align warehouse tuning with broader FinOps practices for engineering and finance.
Treat repeated reads as an architecture problem
Caching, materialized views, and curated marts solve a different problem from query tuning. They reduce how often the platform has to do the same work.
Use each one for a specific reason:
- Query cache for repeated identical queries where underlying data has not changed
- Materialized views for stable aggregations that benefit from incremental refresh behavior
- Curated marts for dashboards and self-service analysis that should never hit raw event tables directly
The trade-off is freshness. A finance dashboard may tolerate a scheduled refresh every few hours. Fraud detection or operational monitoring may not. Cost optimization only works when the latency target is explicit.
A quick technical walkthrough is worth watching before you change production models:
Reduce shuffle and join overhead
Join cost is not just about correctness. It is about data movement. Queries that force large shuffles across big tables can turn a reasonable model into an expensive one.
Start with the basics:
- Filter early, before the join expands the working set
- Join curated subsets instead of raw wide tables
- Check execution details for shuffle-heavy stages and skewed keys
- Pre-aggregate large fact data when consumers do not need row-level detail
This is also where BigQuery cost work differs from generic cloud advice. In compute platforms, overuse often shows up as idle instances or excess autoscaling. In BigQuery, the hidden bill comes from reading and moving far more data than the user intended. That is why teams focused on optimizing cloud computing should treat analytics SQL as infrastructure design, not just analyst activity.
One more trap deserves special attention. Referenced data can still drive billing even when the final output is tiny. If a view, join, or BI query touches broad upstream tables, the bill follows the bytes read, not the size of the result set. That catches experienced teams too, especially when semantic layers and dashboards hide the underlying SQL.
Implementing Governance and Monitoring Your Spend
A BigQuery bill usually goes sideways for a boring reason. Nobody meant to spend that much, but nobody put a hard limit in the path of a costly query, an overactive dashboard, or a service account stuck in a retry loop.

Query tuning reduces waste. Governance contains blast radius.
That distinction matters for SMBs and lean platform teams. In AWS or Azure, you would not leave production without budgets, alerts, and some kind of quota or policy control. BigQuery needs the same treatment. Otherwise one analyst mistake becomes a finance problem before anyone notices.
Put hard stops in front of expensive mistakes
The first control to set is maximum bytes billed. It works like a circuit breaker for ad hoc queries. If a query is estimated to scan more than your threshold, BigQuery fails it before it runs, which is much cheaper than discovering the issue in next month's invoice.
Use that with a few basic controls that teams can maintain:
- Maximum bytes billed: Block oversized queries before they run.
- Project and user quotas: Cap daily usage for exploratory work.
- Separate production and exploration projects: Keep scheduled pipelines away from ad hoc analysis.
- Cost labels and ownership tags: Make each dataset and job traceable to a team.
Those controls are simple, but they change behavior fast. Engineers stop treating the warehouse as infinite. Analysts get feedback at query time, not after finance asks questions.
This is also where FinOps becomes operational instead of theoretical. A shared model for ownership, usage, and accountability helps data teams and finance work from the same numbers. If your team needs that baseline, this guide to what FinOps means in practice is a good starting point.
The referenced data trap needs explicit guardrails
Experienced teams still get caught by the referenced data billing trap. A query can return a tiny result and still read a large amount of underlying data. LIMIT does not make that safe. Neither does a BI tool that hides the SQL behind a chart.
That is why governance has to cover consumption patterns, not just pipeline jobs. Views, semantic layers, and dashboard refreshes often make costs less visible while keeping the underlying scan behavior expensive.
A practical policy looks like this:
| Risk area | Control | Financial effect |
|---|---|---|
| Ad hoc SQL on large tables | Maximum bytes billed | Stops accidental high-scan queries |
| BI queries against raw data | Curated marts and approved views | Reduces repeated full-table scans |
| Service account misuse | Per-project quotas and alerting | Limits runaway retries and loops |
| Shared datasets with unclear ownership | Labels and named owners | Makes chargeback and cleanup possible |
For SMBs, this is usually the difference between a warehouse bill that can be forecasted and one that behaves like incident response.
Monitor behavior before invoices arrive
Invoices are lagging indicators. Job metadata is where cost management happens.
Use job history and INFORMATION_SCHEMA views to look for a few patterns:
- Recurring queries with high bytes processed
- Users or service accounts with unusual spikes in activity
- Scheduled jobs that still run but no longer support a real use case
- Dashboards querying raw fact tables instead of curated tables
This work is similar to cleaning up idle EC2 instances or unattached disks, except BigQuery waste is driven by behavior instead of standing infrastructure. The spend is still real. It is just easier to miss because the warehouse scales automatically.
The staffing side matters too. Cost-aware data engineering is now part of platform maturity, not an optional skill. Teams hiring for DevOps and platform roles increasingly value people who can tie architecture choices to cost outcomes. This overview of salary factors for tech roles is a useful parallel.
Governance that holds up under real usage
The best governance model is boring. It survives turnover, growth, and busy weeks because the safe path is the default one.
Review expensive jobs on a schedule. Require owners for major datasets. Keep exploration separate from production. Alert on abnormal scan volume, not just total monthly spend. If flat-rate capacity is on the table, make that a measured FinOps decision based on stable workload patterns, not a reaction to one ugly bill.
Teams that do this well treat BigQuery like any other spend domain with shared risk. They set limits, assign ownership, and watch for drift before the bill becomes the alert.
Achieving Predictable and Efficient BigQuery Costs
BigQuery cost control isn't about using the platform less. It's about using it with intent.
The teams that stay comfortable with google bigquery costs do three things well. They understand what they're paying for. They engineer their workloads to scan less and recompute less. They put governance in place so one bad query doesn't become a finance incident.
That's the operating model. Pricing knowledge without engineering discipline won't hold. Engineering discipline without guardrails still leaves you open to human error. Governance without workload tuning just makes expensive systems more organized.
BigQuery is still one of the strongest options for SMBs and midsize teams that want a managed analytical warehouse without cluster administration. But the freedom it gives you is the same freedom that creates volatile bills when nobody owns usage patterns.
If your team treats BigQuery the way it treats any other cloud cost domain, the spend becomes much more predictable. Measure the right things. Tune the high-impact queries. Put hard limits where mistakes can happen. Then the monthly bill stops feeling mysterious and starts looking like a system you control.
If you're already serious about cloud cost discipline, CLOUD TOGGLE is worth a look. It helps teams cut waste by automatically powering off idle AWS and Azure compute on schedules that match real usage, with controls that are simple enough for operations teams and safe enough for broader internal use. That's especially useful if your FinOps practice covers more than analytics and you want the same kind of policy-driven savings on infrastructure that you're now applying to BigQuery.