Google's Cloud Monitoring is the platform's built-in tool for keeping an eye on everything. It gives you a clear view of the performance, uptime, and general health of your apps and infrastructure, both on the Google Cloud Platform and even for services running elsewhere.
Simply put, it’s the command center for your entire cloud setup, constantly collecting signals and telling you what needs your attention.
What Is Google Cloud Monitoring and Why Is It Essential
Think of your Google Cloud environment as a huge, sprawling city. Your applications are the skyscrapers, your virtual machines are the power plants, and your databases are the water mains. In this city, Google Cloud Monitoring is the central control room, giving you a live map of every street, building, and utility.
This control room’s job is to provide visibility. It answers the really important questions: Is traffic flowing smoothly between your services? Is a power outage about to hit one of your server clusters? Without this oversight, you’re flying blind and only reacting to problems after they cause a city-wide blackout, or in our world, a major service outage.
The Foundation of Operational Stability
Solid cloud monitoring isn't a "nice-to-have" anymore; it's absolutely essential for modern business. The market reflects this. Valued at $2.96 billion in 2024, the global cloud monitoring market is expected to explode to $9.37 billion by 2030. This isn't just hype; it's driven by the rise of DevOps and Site Reliability Engineering (SRE), fields that run on real-time data.
For your technical teams, this kind of visibility is the bedrock of a stable system. It helps with:
- Proactive Issue Detection: Spotting small issues, like a slow database query, before they spiral into major incidents that your users will notice.
- Performance Optimization: Finding the bottlenecks in your application or infrastructure so you can make things faster and more responsive.
- Intelligent Capacity Planning: Using past data to predict future needs, so you always have enough power without paying for resources you don't use.
A Bridge Between DevOps and FinOps
But Google Cloud Monitoring is about more than just keeping the lights on. It builds a crucial bridge between your technical teams (DevOps) and your finance-focused teams (FinOps). The same metrics that show an application's health can also shine a spotlight on financial waste.
For instance, if a dashboard shows consistently low CPU usage on a dozen virtual machines, that's an operational insight with a direct financial consequence. You're paying for capacity you aren't using.
This dual capability is key. By translating performance data into financial terms, teams can make informed decisions that improve both reliability and the bottom line. It sets the stage for turning raw data into tangible cost savings.
This is where you get real value. Monitoring tells you what is happening, but the goal is to use that information to take action. You can learn more about the core ideas in our guide on effective strategies for monitoring in the cloud. Once you understand how your environment behaves, you can start managing your cloud resources, and your budget, much more effectively.
The Core Features of Google Cloud Monitoring
To really get a handle on Google Cloud Monitoring, you need to understand its four main features. Think of them as a team of specialists, each with a specific job, all working together to give you a complete picture of your environment's health. They’re what turn a flood of raw data into insights you can actually use to keep your services reliable and running fast.
Let's break them down one by one. Each plays a critical role, from deep data investigation to automatically spotting problems before they escalate.
Metrics: The Investigator
Metrics are the raw, numerical data points collected from your infrastructure and applications. They measure just about everything, from the CPU usage of a virtual machine to the request latency of an API. This constant stream of data is the lifeblood of the entire monitoring system.
Your main tool for digging into this data is the Metrics Explorer. It’s like a powerful search engine for your system's performance. You can use it to slice, dice, and visualize any metric in real-time, helping you find the root cause of an issue or just get a feel for how a service is behaving under load.
Dashboards: The Storyteller
While Metrics Explorer is great for digging in on the fly, Dashboards are where you tell the long-term story of your system’s health. A dashboard is a customizable collection of charts and graphs that puts your most important metrics in one place, organizing complex information into a clear, visual story that anyone on your team can understand.
Think of a dashboard as the cockpit of an airplane. It gives pilots an immediate, at-a-glance view of all critical systems, allowing them to make informed decisions quickly. In the same way, a well-designed monitoring dashboard gives your team the essential info needed to keep your services flying smoothly.
For instance, you might build one dashboard to track your web servers, another for your databases, and a third to monitor billing and costs. Many teams also use tools like Grafana to build even more advanced and customized dashboards. If you're weighing your options, our guide on Datadog vs Grafana offers some helpful comparisons.
Alerting: The Watchdog
Dashboards are great for people to look at, but you can’t stare at them 24/7. That's where Alerting comes in. Alerting is your automated watchdog, constantly scanning your metrics for any sign of trouble. You set the rules, and it takes action when they’re broken.
You can set up alerting policies to notify your team through channels like email, Slack, or PagerDuty when specific thresholds are crossed. For example, you can set an alert to go off if CPU utilization on a server group stays above 85% for more than five minutes. This proactive approach means you find out about problems right away, often before your users even notice.
Uptime Checks: The Guardian
Finally, Uptime Checks act as your external guardians. They make sure your applications are reachable and responsive from different locations around the world. These checks act like real users, regularly "pinging" your public endpoints to ensure they are online and responding correctly.
This is a non-negotiable feature for any user-facing service. If an uptime check fails, it means your customers can't get to your application. Google Cloud Monitoring will immediately send an alert, letting you know your service is down so you can start fixing it right away.
To wrap it up, these four components work hand-in-hand to provide a robust monitoring solution. Here’s a quick summary of how they fit together.
Google Cloud Monitoring Core Features Overview
| Feature | Primary Function | Key Benefit |
|---|---|---|
| Metrics & Metrics Explorer | Collects raw numerical data and provides tools for real-time investigation. | Enables deep-dive analysis to find the root cause of performance issues. |
| Dashboards | Creates customizable, visual representations of key metrics. | Provides a clear, at-a-glance overview of system health for the entire team. |
| Alerting | Automatically monitors metrics against predefined thresholds and sends notifications. | Ensures proactive problem detection 24/7, reducing downtime and user impact. |
| Uptime Checks | Verifies application accessibility and responsiveness from external locations. | Confirms that your services are online and available to customers worldwide. |
Together, these features give you the visibility and control needed to run reliable applications on Google Cloud.
Setting Up and Integrating Your Monitoring Environment
Getting your monitoring environment up and running in Google Cloud is often easier than people think. For most of the core services you use, like Compute Engine or Cloud SQL, basic monitoring is switched on by default. The second you launch a new resource, Google is already collecting fundamental metrics for you, no setup required.
This out-of-the-box coverage gives you a great starting point. But for a truly deep understanding of what's happening, especially inside your virtual machines, you’ll want to bring in the Ops Agent. This is a small but mighty piece of software you install on your VMs to pull in much richer telemetry, like application-specific logs and advanced system metrics.
Think of the Ops Agent as your own dedicated reporter embedded inside each server. It captures the high-fidelity details that standard monitoring might otherwise skim over, giving you a far more detailed dataset for troubleshooting problems and fine-tuning performance.
Creating a Central Observability Hub
One of the biggest advantages of Google Cloud Monitoring is its power to become your central hub for observability. It isn't meant to live in a silo; it’s built to pull in data from all over the place, giving you that "single pane of glass" view across your entire tech stack.
Some of the most important integrations include:
- Google Cloud Logging: Monitoring and logging are two sides of the same coin. This native link lets you directly correlate a metric (like a sudden spike in 500 errors) with the exact log entries that explain why it's happening.
- Third-Party Tools: Many teams rely on popular open-source tools. Google Cloud Monitoring plays nicely with them, allowing you to forward metrics from other systems into one central place.
- Notification Channels: You can hook your alerts directly into the tools your team uses every day, whether that's Slack, PagerDuty, or just plain old email. This ensures the right people get notified the moment an issue arises.
This ability to pull all your data together is what separates a good monitoring setup from a great one. It breaks down information silos and gives your teams the full story. If you're looking to unify your log data as well, check out our guide on building a centralized log analytics workspace.
Integrating with Prometheus and Grafana
When we talk about third-party tools, two names come up constantly: Prometheus and Grafana. Prometheus is a giant in the open-source monitoring world, and Grafana is famous for its incredibly powerful and flexible dashboards.
A lot of engineering teams simply prefer Grafana's visualization capabilities. The good news is you can set up Google Cloud Monitoring as a data source directly within Grafana. This setup offers the best of both worlds: you use Google's robust, scalable infrastructure to collect all your metric data, but you get to visualize, explore, and build alerts on it using Grafana's best-in-class interface.
This flow, from raw data collection to actionable insight, is what effective monitoring is all about.
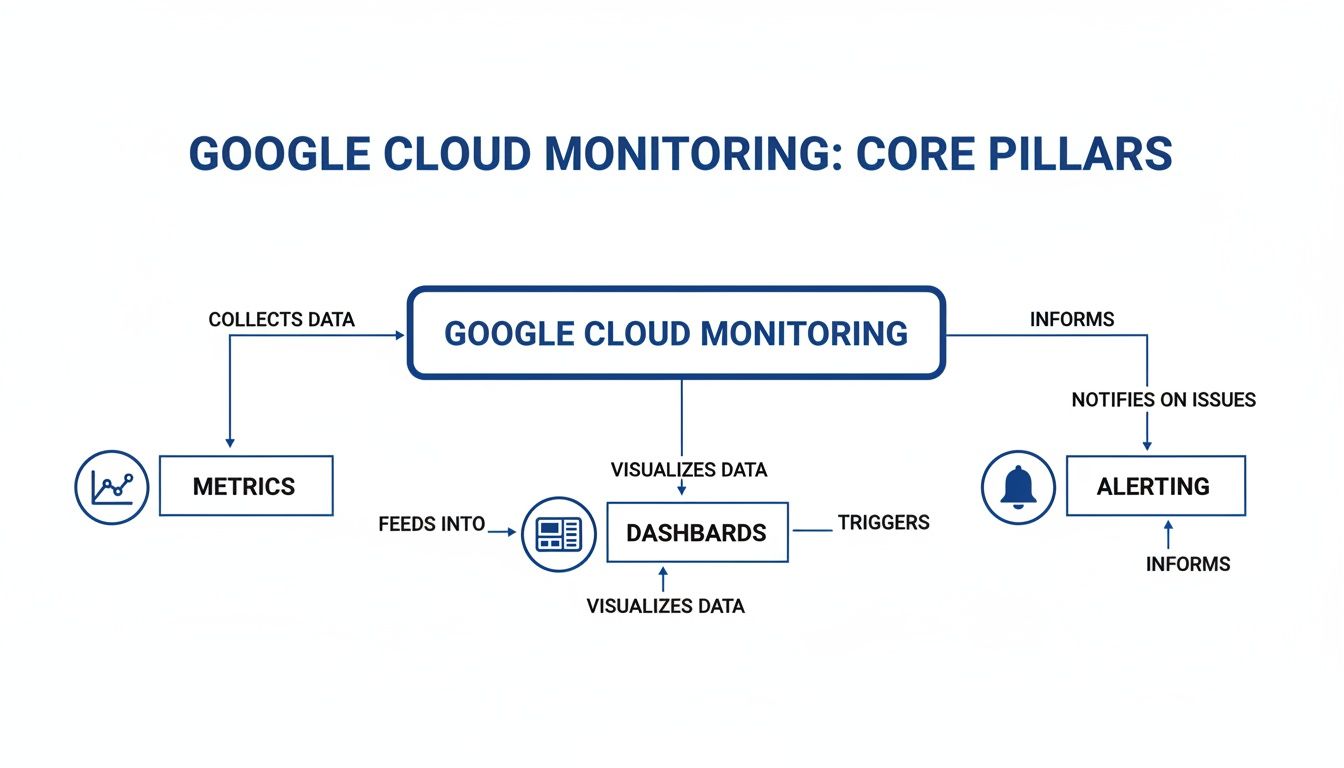
As the diagram shows, raw metrics are the foundation. They get organized into dashboards for human analysis and are also used to trigger automated alerts when something goes wrong. This complete cycle is the key to maintaining a healthy and performant system.
Practical Use Cases for DevOps and FinOps Teams
The real value of Google Cloud Monitoring isn't just collecting metrics; it's what you do with them. When theory hits reality, this data becomes the key to solving real-world business problems, from preventing outages to slashing cloud waste.
Let's look at how two very different teams, DevOps and FinOps, use the exact same monitoring platform to hit their unique, yet connected, goals.
How DevOps and SRE Teams Improve Reliability
For DevOps and Site Reliability Engineering (SRE) teams, one thing matters above all else: keeping services fast, stable, and online. Google Cloud Monitoring is their go-to diagnostic tool for making that happen.
Their day-to-day work is all about performance and uptime, which breaks down into a few key activities:
- Defining and Monitoring SLOs: Teams set Service Level Objectives (SLOs), which are hard promises to their users. Think goals like, "99.9% of homepage requests must load in under 500ms." They then build dashboards in Cloud Monitoring to see exactly how they're tracking against those promises in real-time.
- Diagnosing Application Latency: When an app slows down, DevOps engineers jump into Metrics Explorer. By overlaying metrics like CPU load, disk I/O, and API response times, they can quickly find the bottleneck that’s causing the lag.
- Automating Performance Alerts: They don’t wait for things to break. Instead, they set up alerts for early warning signs, like if error rates suddenly jump by 20% over a five-minute period. That alert can ping the on-call engineer in Slack or PagerDuty, giving them a chance to fix it before it turns into a full-blown outage.
For these technical teams, monitoring is the bedrock of a good user experience. It helps them get ahead of problems instead of just reacting to them.
How FinOps Teams Drive Financial Efficiency
While DevOps watches uptime, FinOps teams examine the very same data but ask a different question: "Are we getting value for our money?" Their job is to make sure every dollar spent in the cloud is a dollar well spent. For them, Google Cloud Monitoring is a powerful cost-control tool.
The growth of platforms like Google Cloud, which saw its revenue climb to over $43 billion in 2024, shows just how critical this financial governance has become. As more companies go all-in on GCP, reining in costs is just as important as performance. You can dig into Google Cloud's growing market presence on Statista.
For FinOps, cloud monitoring is the source of truth for financial accountability. It connects operational metrics directly to business costs, allowing for data-driven spending decisions.
Here's how FinOps teams put monitoring to work:
- Pinpoint Underutilized Resources: A dashboard showing a dozen virtual machines with CPU usage stuck below 5% is a giant red flag for wasted money. This data gives teams the confidence to safely shut down or resize those idle instances.
- Track Spending Against Budgets: By creating dashboards that map current spending against forecasts, FinOps leaders can spot if a project is going over budget and immediately ask why.
- Alert on Cost Spikes: FinOps can configure billing alerts to fire when daily or weekly costs jump past a set threshold. This is a lifesaver for catching runaway expenses, like a buggy script or a misconfigured service, before they cause a nasty surprise on the monthly invoice.
How to Turn Monitoring Insights Into Cost Savings

Google Cloud Monitoring is brilliant for spotting problems and giving you a clear view of what’s happening in your environment. It’ll show you a dozen virtual machines running at only 5% CPU or point out that your dev servers are humming away all weekend. But there’s a big gap between seeing this waste and actually fixing it.
This is the classic challenge of idle compute cost. Your monitoring dashboard gives you the insight, but insight alone doesn’t lower your bill. You need a way to act on that data. Simply knowing a resource is idle is only step one; the next is turning it off without creating more manual work for your team.
This is where specialized automation tools come in. They bridge the gap between monitoring data and real-world savings by acting on the insights your dashboards provide.
Automating the Shutdown of Idle Resources
One of the most effective FinOps strategies is simply powering down non-production resources when they aren't being used. Environments for development, staging, and testing often sit idle for over 12 hours a day and all weekend, burning through your budget for no good reason.
Automation tools connect directly to your cloud accounts and can be set up to shut down these resources on a predictable schedule. Think of it as putting your dev servers to sleep every night and on weekends, then waking them up only when your team is back online.
This simple, scheduled action delivers immediate and predictable savings. It completes the cycle that Google Cloud Monitoring starts, turning a passive observation into an active cost-reduction measure.
The goal is to move from manual intervention to automated governance. Instead of an engineer needing to remember to shut down a test cluster, the system does it for them automatically, guaranteeing savings and freeing up developer time.
Why Automation Beats Manual Efforts
While you could script this process yourself, dedicated tools offer some major advantages that are tough to replicate with manual scripts. These benefits help ensure your cost-saving efforts are both effective and sustainable.
- Ease of Use: You can set complex schedules through a simple web interface without writing a single line of code.
- Centralized Control: Manage schedules for hundreds of resources across multiple teams, and even different cloud providers, from one place.
- Flexible Overrides: If a developer needs to work late, they can easily override the shutdown schedule for their specific machines without needing broad account permissions.
- Safe Delegation: You can give team leads the power to manage their own schedules without exposing sensitive cloud credentials or settings.
Effective cloud monitoring is a cornerstone of solid governance in the cloud, helping you maintain control, manage costs, and ensure security. By pairing monitoring insights with automated actions, you build a system that not only ensures operational health but also actively protects your bottom line.
Frequently Asked Questions About Google Cloud Monitoring
When you start digging into a tool like Google Cloud Monitoring, a few practical questions almost always pop up. Whether you're trying to figure out the real cost or stacking it up against other tools you’ve used, getting straight answers is important.
Let's clear up some of the most common points of confusion teams face when they adopt or fine-tune their Google Cloud monitoring strategy.
Is Google Cloud Monitoring Free to Use?
Yes and no. Google Cloud gives you a pretty generous free tier for its monitoring services, which is often more than enough to get started or for smaller projects. This includes a certain amount of metric data, API calls, and uptime checks every month without costing you a dime.
Once you cross those free limits, though, you start paying for what you use. The costs are mostly tied to the volume of metric data you send to the service. This is a key detail because as your apps grow and you start sending more custom metrics, you’ll almost certainly move into the paid tier.
How Does It Compare to Other Tools Like Datadog?
The biggest advantage for Google Cloud Monitoring is that it’s the native, deeply integrated solution for the Google Cloud world. It just works with most GCP services right out of the box.
Tools like Datadog, on the other hand, are third-party platforms famous for their massive library of integrations across multiple clouds (AWS, Azure, GCP) and tons of other software.
Here’s a quick breakdown:
- Integration: Google Cloud Monitoring has that seamless, built-in feel for GCP services. Datadog offers a much wider net of integrations across different platforms, but they aren't as "native."
- Cost: Google’s pricing is tied directly to your data volume, which can be simpler to manage if you're all-in on GCP. Datadog's pricing is often per-host or per-million-metrics, which can get more complicated to forecast.
- User Experience: Many developers find Datadog's dashboards and UI to be more polished and intuitive, although Google is constantly making improvements to its own interface.
The right choice really depends on your setup. If your entire infrastructure is on Google Cloud, the native monitoring tool is a powerful and convenient option. But if you’re running in a multi-cloud environment, a third-party tool might give you that unified view you’re looking for.
Can I Use Grafana with Google Cloud Monitoring?
You absolutely can. In fact, it’s a very common and powerful setup. Lots of engineering teams simply prefer Grafana's advanced dashboards and visualization options. You can easily set up Google Cloud Monitoring as a data source inside Grafana.
This approach gives you the best of both worlds. You let Google's powerful infrastructure handle collecting and storing all your metrics, while using Grafana's flexible and rich interface to build dashboards, explore data, and set up alerts.
This is a popular strategy because it lets teams stick with a single, familiar tool (Grafana) to visualize data from many different sources, not just Google Cloud.
By turning the insights from Google Cloud Monitoring into direct action, you can achieve significant savings. CLOUD TOGGLE helps you automate the process of shutting down idle cloud resources, ensuring you only pay for what you actually use. Learn how you can start reducing your cloud bill today at https://cloudtoggle.com.