Let's get one of the most common mix-ups in business straightened out. People throw around the terms metrics and KPIs like they're the same thing, but they’re really not.
The simplest way to think about it is this: Metrics measure a process, while KPIs measure progress toward a big-picture goal. You could say all KPIs are a type of metric, but only a handful of your most important metrics ever get to be called a KPI.
The Real Difference Between Metrics And KPIs

Think about your car's dashboard. It's covered in gauges and numbers showing your speed, how much gas you have left, and your engine RPM. Those are your metrics. They're all quantifiable data points that give you critical, real-time information about how your car is running.
Now, where are you going? The single most important number for that journey is your GPS showing the 'Estimated Time of Arrival' (ETA). That's your Key Performance Indicator (KPI).
Your speed is a metric that directly influences when you'll get there, sure. But the ETA is the KPI that tells you if you're actually on track to succeed. It directly connects your actions (driving) to your main objective (arriving on time).
Why The Distinction Matters
This isn't just a matter of semantics; it’s crucial. You could track dozens, even hundreds, of different metrics. But only a select few truly signal whether you're making progress toward your most important business outcomes.
Getting this right helps you focus on what actually drives success instead of drowning in a sea of data. For example, you might track:
- Page Views: This is a metric. It tells you how many times a webpage was loaded.
- Conversion Rate: This is a KPI. It shows you the percentage of visitors who actually did what you wanted them to, like signing up for a trial.
The page views metric certainly informs the KPI, but it's the conversion rate that truly measures if you're hitting your business goal.
A metric is any quantifiable measure used to track a specific business process. A KPI, on the other hand, is a specific, measurable value that shows exactly how effectively you're achieving a key business objective.
From Data Overload To A Clear Roadmap
In the world of cloud computing, you're not just dealing with a few data points; you're bombarded with thousands of potential metrics. Everything from CPU utilization and memory usage to data transfer costs is being measured. Trying to track all of them is a recipe for disaster.
This is where the distinction between metrics and kpis becomes your most powerful tool for financial control.
By carefully selecting a handful of KPIs, you can cut through the noise. You transform that overwhelming flood of cloud data into a clear, actionable roadmap for saving money. Choosing the right KPIs is the essential first step. It lets you concentrate your team's efforts on actions that have a direct, measurable financial impact.
If you want to learn more about how to gather this data effectively, check out these best practices for monitoring cloud services. This focused approach ensures your team isn't just busy looking at data, they're actively driving business value.
Why You Need KPIs, Not Just Metrics, for Cloud Success
Chasing the wrong numbers is an expensive habit. Too many companies fall into the trap of tracking "vanity metrics": data points that look great on a dashboard but don't actually move the needle on business results. Think of it like celebrating how many visitors your website gets; a big number feels good, but it tells you nothing about whether those visitors are actually buying anything.
This quickly leads to a state of analysis paralysis. When your teams are staring at a mountain of data, they don't know where to start. This is especially true in the cloud, where the sheer volume of available metrics can be completely overwhelming, leading to confusion, inaction, and a lot of wasted money. The real trick is to move beyond just monitoring everything and instead pinpoint a few key performance indicators (KPIs) that get everyone pulling in the same direction toward a critical goal.
Drowning in Data is a Real Danger
For instance, a business might brag about running thousands of active cloud instances, thinking it's a sign of rapid growth. But that's just a metric. A much more telling KPI would be Idle Compute Cost, which measures exactly how much money is being torched on resources that are running but doing absolutely zero productive work. See the difference? One is a flashy number, the other is a direct measure of financial health.
Understanding the distinction between metrics and KPIs is what separates the companies drowning in their cloud bills from those who have mastered them. It lets you:
- Focus Your Resources: Aim your team's valuable time and energy at actions that create a real, measurable impact.
- Drive Accountability: Hold teams responsible for meaningful outcomes, not just for being busy.
- Make Smarter Decisions: Go from passively watching numbers to actively using them to steer the business.
Turning Measurement Into Momentum
With global public cloud services expected to grow 21.5% this year, getting a handle on these costs has never been more important. Despite everyone’s best efforts, an estimated 27% of all cloud spending is still completely wasted, which adds up to billions of dollars down the drain. You can dive deeper into these cloud computing statistics to get the full picture, but the takeaway is clear: a focused approach is non-negotiable.
By choosing KPIs that directly tackle your biggest financial headaches, you create a clear roadmap for success. You stop asking, "How many servers are we running?" and start asking, "What is our Cloud Savings Rate this quarter?"
This simple shift from broad, passive measurement to targeted, active performance indicators is the secret to unlocking major savings. It transforms that confusing flood of data into a powerful tool for driving your business forward and achieving real financial control over your cloud.
Essential Cloud Cost KPIs You Need To Track
Alright, let's move from theory to practice. To get a real grip on your cloud bill, you need to zero in on the specific KPIs that actually matter. While every company's needs are a bit different, a handful of core numbers consistently paint the clearest picture of your financial health in the cloud. These are the indicators that turn messy billing data into a roadmap for real savings.
The journey starts by cutting through the noise. You have tons of data points (metrics), but only a few of them are true indicators of business success (KPIs).
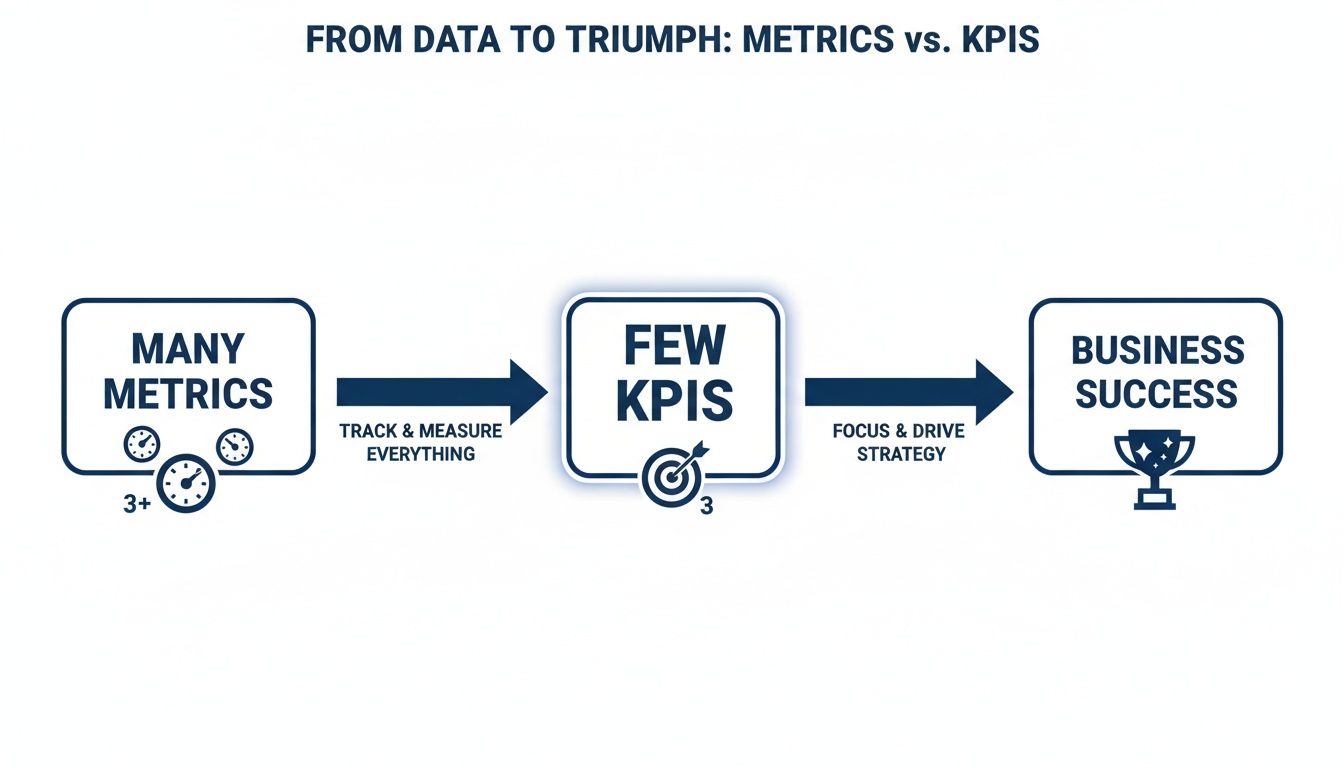
As you can see, the trick is to filter out the endless stream of data and concentrate on the select few KPIs that point you directly toward your goals.
Idle Compute Cost
If there's one KPI to rule them all in cloud cost control, it's Idle Compute Cost. This number measures exactly how much money you're spending on resources that are switched on but doing absolutely nothing useful. Think of it less as a technical metric and more as a direct measure of financial waste.
It's a bigger problem than most people realize. A stunning 27% of all cloud spend is wasted on idle or oversized resources. This is the low-hanging fruit: forgotten test servers, over-provisioned instances, and machines left running 24/7 when they’re only needed during business hours.
Idle Compute Cost is the dollar value of leaving the lights on in an empty office building all night. Calculating it shines a spotlight on exactly where your budget is evaporating without adding a shred of business value.
This KPI is gold for both FinOps and DevOps teams. It gives them a clear, financially-grounded target for their optimization efforts, like putting automated shutdown schedules in place.
Cost Per Environment
Next up is Cost per Environment. This KPI breaks down your total cloud spend by specific environments, such as development, staging, or production. It's all about allocating costs accurately to understand the financial footprint of each stage in your development lifecycle. Without this visibility, you’re just guessing when it comes to budgeting.
To get this number, you absolutely need a solid tagging strategy to group resources correctly. Once you have the data, you can dive deep into something like an AWS Cost and Usage Report to see the full picture. This KPI is what allows teams to ask the tough questions, like whether the cost of a non-production environment is justified by its business value.
To help you get started, here is a quick overview of the most impactful KPIs you can track, what they tell you, and who should be paying attention to them.
Key Cloud Cost KPIs At A Glance
| KPI (Key Performance Indicator) | What It Measures | Why It's Important | Primary Stakeholder |
|---|---|---|---|
| Idle Compute Cost | Money spent on running resources that are performing no work. | Directly identifies and quantifies pure financial waste. | FinOps, DevOps |
| Cost Per Environment | Total spend associated with a specific environment (dev, prod). | Enables accurate cost allocation and budgeting for projects. | Engineering Leads |
| Cloud Savings Rate | Cost savings from optimization as a percentage of the total bill. | Proves the ROI of FinOps initiatives and tools like CLOUD TOGGLE. | Finance, IT Leaders |
| Schedule Adherence | How often automated on/off schedules are followed vs. overridden. | Indicates the effectiveness of automation policies and team discipline. | DevOps, Team Leads |
This table gives you a solid starting point. By focusing on these indicators, you can move beyond simply seeing your cloud bill to actively managing it.
Other Vital KPIs to Monitor
While Idle Compute Cost and Cost Per Environment are foundational, two others will give you a much more complete picture of how well your cost management strategy is working.
Cloud Savings Rate: This KPI measures the total cost savings you’ve achieved through optimization, shown as a percentage of your total cloud bill. It's the ultimate proof that your FinOps efforts are paying off and helps justify any investment in cost-saving tools.
Schedule Adherence: This one is simple but powerful. It tracks how consistently your automated on/off schedules are being followed versus manually overridden. High adherence means your automation is working as planned. Low adherence is a red flag that you need to adjust your schedules or figure out why teams feel the need to keep resources running longer.
How To Set And Measure Your Cloud KPIs Effectively
Knowing which key performance indicators to track is a great start, but it's only half the battle. The real trick is building a practical framework to implement them successfully and turn those insights into actual savings. It all comes down to setting realistic goals and getting into a consistent rhythm of measuring your progress.
Your first step, always, is to establish a baseline. You can't hit a target if you don't know where you're starting from. Dive into your current cloud bills and get a clear picture of what you're spending today on specific environments or resource types. This data becomes the benchmark you'll measure all future improvements against.
Once you have that baseline, you can set an initial target that's actually achievable. Don't try to boil the ocean by aiming for a massive, unrealistic reduction right out of the gate. Start with a modest goal that lets you build momentum and score some early wins for your team.
Setting Achievable Targets
A fantastic starting point is to aim for a 10% cost reduction in your non-production environments. Why? Because this target is specific, measurable, and realistic enough to knock out within a single quarter. Nailing this first goal proves the value of your efforts and builds a solid business case for bigger optimization projects down the road.
- Baseline First: Tally up your current monthly spend on all your development and staging environments.
- Set a Clear Goal: Define a simple, powerful target, like: "Reduce non-production spend by 10% in 90 days."
- Track Progress: Keep a close eye on your Cost per Environment KPI each week to make sure you're on track.
Achieving this initial goal sends a clear message: focused efforts on metrics and kpis deliver real financial returns.
Establishing a Reporting Rhythm
Consistency is everything when it comes to managing KPIs. You need a regular cadence for reviewing the data, sharing progress, and making course corrections. Different teams will need different reporting frequencies depending on what they do.
Establishing a consistent reporting rhythm transforms KPI tracking from a passive, occasional activity into an active, strategic process. It ensures accountability and keeps cost optimization a priority for everyone involved.
For example, a weekly operational check-in is perfect for engineering teams to review KPIs like Schedule Adherence. It lets them spot and fix automation issues on the fly. On the other hand, a monthly strategic review works better for leadership to assess high-level KPIs like the overall Cloud Savings Rate. This approach gets the right information to the right people at just the right time. The goal is to turn raw data into a productive conversation.
It's not just about defining KPIs; a solid approach to metrics and reporting is crucial for driving the business forward. One of the best ways to do this is by visualizing your progress with simple dashboards. This visibility makes it easy to celebrate wins, highlight areas needing more attention, and keep the whole organization aligned.
If you're looking to build a stronger financial operations culture, you might be interested in our guide explaining what FinOps is and how it can help.
Role-Based KPIs In Action

Let's make this real. To truly grasp the difference between metrics and KPIs, it helps to see how they function in the wild and how different people in different roles use them to hit specific targets.
The right KPI gives a clear line of sight from someone's daily work straight to the company's bottom line. Think of it as giving each person the right compass for their part of the journey.
A Chief Technology Officer (CTO), for example, isn't sweating the uptime of a single server. They're steering the whole ship. Their primary KPI might be the overall Cloud Savings Rate, a single number they can report to the board to prove that optimization efforts are actually working.
A DevOps Engineer, on the other hand, is deep in the engine room. Their success is tied to the gears of automation running smoothly and efficiently.
KPIs For Different Teams
For the DevOps engineer, the most important performance indicator is Schedule Adherence. A high adherence rate is proof positive that automated on/off schedules are doing their job. A low rate? That’s a red flag. It means manual overrides are happening too often, and the system needs a tune-up.
Meanwhile, a FinOps Manager is all about budget accuracy and predictability. They live and breathe the Cost per Environment data. This KPI lets them slice and dice spending for development, staging, and production, keeping forecasts tight and teams accountable for what they use.
By assigning role-specific KPIs, you empower every stakeholder. Everyone understands exactly how their actions contribute to the company's financial goals, creating a shared sense of ownership over cloud costs.
For a deeper dive into how KPIs can be tailored to specific roles and responsibilities, this guide on defining Employee Key Performance Indicators offers some great insights. It's all about making sure every team is pulling in the same direction.
A Few Common Questions About Cloud KPIs
Diving into cloud cost management always surfaces a few practical questions. Let's tackle some of the most common ones I hear about putting metrics and KPIs to work.
How Often Should We Be Looking at Cloud KPIs?
The right cadence really depends on the KPI and who's looking at it.
For your operational KPIs, like Schedule Adherence, the DevOps team should probably be checking in weekly. This lets them spot and fix scheduling drift before it turns into a big budget problem.
Broader financial KPIs, such as the Cloud Savings Rate, are a better fit for monthly or quarterly reviews with your FinOps team and leadership. This timeline is much more practical for tracking progress against bigger, long-term goals. If you're just starting out, a monthly review for all your main KPIs is a great baseline. You can always adjust as you learn what works for your organization.
A good way to think about it is this: operational KPIs are your weekly health checkups, while financial KPIs are your quarterly strategic planning sessions. Both are vital, but they serve different purposes and run on different schedules.
Can We Track Cloud KPIs Without Buying a Special Tool?
Sure, it's possible. You can always export your billing data and slice and dice it in a spreadsheet. But I have to be honest, this approach is incredibly time-consuming, wide open to human error, and just doesn't scale as your cloud footprint gets bigger.
Automation tools are built to handle the tricky parts, like accurately calculating the savings you get from scheduled shutdowns and, more importantly, making sure those schedules are actually being followed. While manual tracking might work for a week or two, automation is what makes the whole process efficient, accurate, and ultimately successful in the long run.
How Do We Pick the Right KPIs to Start With?
The key is to start small and focused. First, ask your team: what is our single most important cloud management goal right now? Are you trying to slash overall spending? Do you need better budget predictability for a few key projects? Or is your main goal to prove the ROI of your optimization efforts to leadership?
Once you have a crystal-clear objective, pick just one or two KPIs that directly measure your progress toward it. For instance, if your biggest headache is waste in non-production environments, start by tracking Idle Compute Cost. Don't make the mistake of trying to measure everything at once. Focus on the indicators that will deliver the biggest impact on your number one goal.
Ready to turn those insights into real action and start crushing your cloud cost KPIs? CLOUD TOGGLE makes it simple to automate savings by shutting down idle resources. It's a powerful way to boost your Cloud Savings Rate and Schedule Adherence right out of the gate.
Start your free trial and see for yourself.