Your app is calm all morning, then a marketing email lands and response times spike. Or the opposite happens. You sized the deployment for peak traffic, but most of the day those extra pods sit there burning money.
That’s where people usually ask, what is HPA, and whether it’s the same thing as “autoscaling.” In Kubernetes, HPA is often the first scaling feature teams reach for because it solves a very practical problem: matching pod count to demand without someone babysitting the cluster.
What is HPA and Why Does It Matter for Your Apps
HPA stands for Horizontal Pod Autoscaler in Kubernetes. It watches a metric you choose, compares current usage to a target, and increases or decreases the number of pod replicas for a workload like a Deployment.
If you're new to Kubernetes, think of HPA as the system that answers one question over and over: do we need more copies of this app right now, or fewer?
That matters because teams often struggle with one of two failure modes:
- Under-scaling: too few pods during traffic spikes, which means slow requests, timeouts, and unhappy users.
- Over-scaling: too many pods running during quiet periods, which means wasted compute and higher cloud bills.
Kubernetes HPA helps with both. It lets your application expand when load rises and shrink when demand falls. That’s a core part of Cloud Computing Scalability, especially when you want reliable performance without paying for peak capacity all day.
There’s another common point of confusion. HPA is an overloaded acronym in other fields. This article is about the Kubernetes Horizontal Pod Autoscaler, not atmospheric pressure and not the stress-response HPA axis in medicine.
Main idea: HPA improves availability and cost control at the same time, but only when your app can scale out cleanly.
If you want a broader Kubernetes-focused introduction before getting into manifests and tuning, this guide on autoscaling in Kubernetes is a useful companion.
Understanding the HPA Control Loop
HPA works like a thermostat. A thermostat doesn’t ask whether your house is “good” or “bad.” It checks the current temperature, compares it to the target, and reacts. HPA does the same thing with application metrics.
The loop in plain language
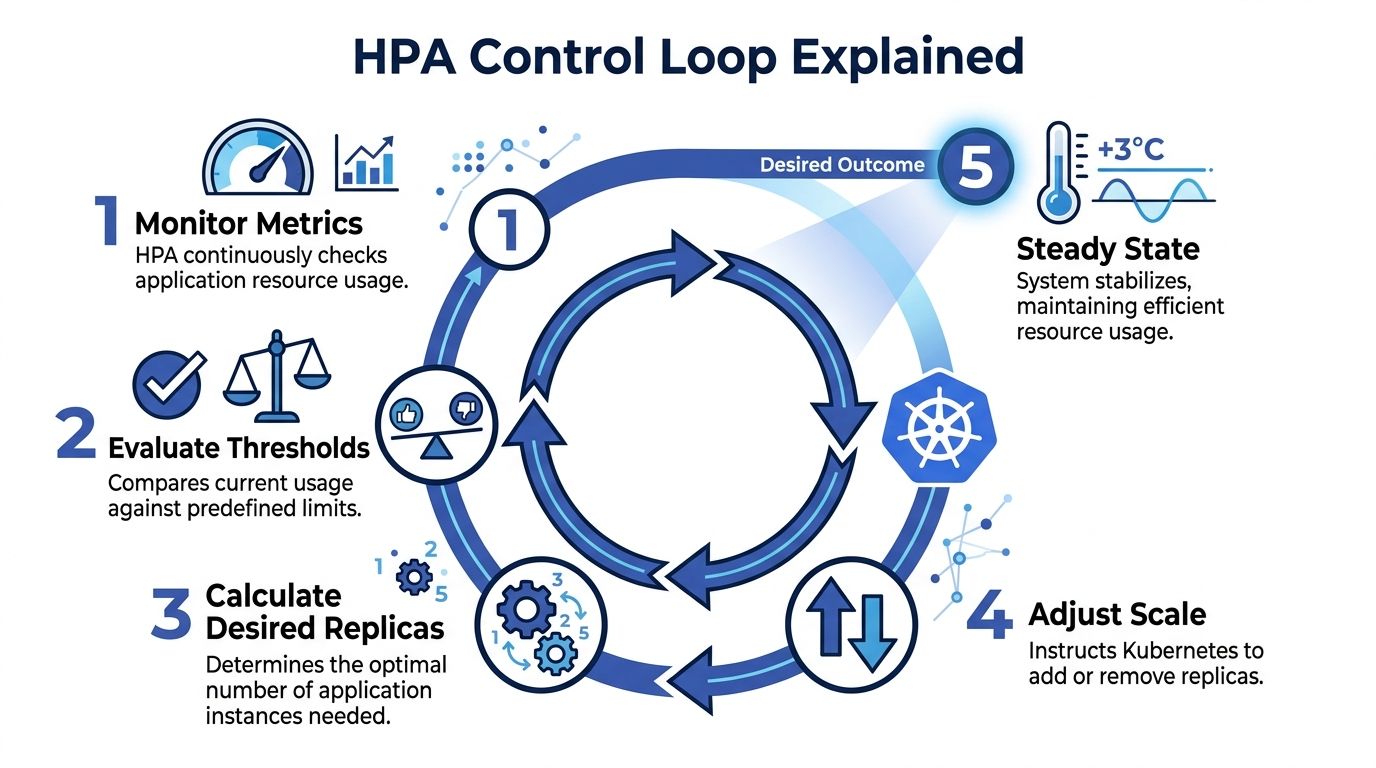
A typical HPA cycle looks like this:
Metrics are collected
Kubernetes needs a metrics source. For CPU and memory, that usually means Metrics Server.Current usage is compared to your target
If your target CPU utilization is 60%, HPA asks whether the current average is above or below that mark.A desired replica count is calculated
HPA decides whether the workload needs more pods or fewer pods.Kubernetes updates the workload
The Deployment or ReplicaSet gets a new desired replica count.Pods are created or removed
The scheduler places new pods if scaling out is needed, or old pods are terminated when scaling in makes sense.
That cycle repeats continuously. The point isn't elegance. The point is operational stability.
Why this matters in production
New engineers often assume HPA directly scales “servers.” It doesn’t. It scales pods. If the cluster doesn’t have room for those new pods, another mechanism has to add nodes. That distinction matters because pod scaling and infrastructure scaling are related, but they aren’t the same job.
Another confusion point is timing. HPA is reactive. It responds to observed conditions. That makes it great for elastic workloads, but it also means you still need good requests, startup behavior, and realistic scaling boundaries.
HPA is only as smart as the metrics and limits you give it.
From a cost angle, the control loop is useful because it reduces the habit of provisioning for worst case all day. Instead of locking in peak pod count, you let Kubernetes adjust toward actual demand.
Choosing the Right Metrics for Autoscaling
Picking the wrong metric is one of the fastest ways to make HPA feel broken. The controller might be working perfectly, but if the metric doesn’t reflect user demand, scaling decisions will still be poor.

Resource metrics
The most common starting point is CPU. Sometimes memory also makes sense.
If your app does real compute work per request, CPU is often a clean trigger. A CPU-based HPA with a target utilization means, in practice, “keep average CPU use around this level by changing replica count.”
Use resource metrics when:
- CPU fits the workload: API services, renderers, and compute-heavy web backends often respond well.
- Memory reflects load: some services hold more in-memory state or cache under heavier traffic.
- You want the simplest setup: resource metrics are usually easier to get running than custom pipelines.
CPU is often a good first draft, but it’s not always a good final answer.
Custom metrics
Custom metrics are app-aware. They tell HPA something about how the service behaves, not just how hard the container is working.
Examples include:
- Requests per second from an ingress or service mesh
- Active sessions
- In-flight requests
- Business events processed per pod
These are useful when CPU stays flat but user load still grows. A common example is an I/O-heavy service where pods wait on databases or third-party APIs. CPU might look calm while the request queue inside the app gets ugly.
Practical rule: If users feel pain before CPU rises, CPU alone probably isn't the right scaling metric.
External metrics
External metrics come from outside the pod itself. Queue depth is the classic example.
If you run worker pods that pull jobs from systems like SQS or another message broker, queue length often beats CPU by a mile. A worker can have low CPU and still be badly behind. In that case, the business problem is backlog, not processor saturation.
Use external metrics when the demand signal lives outside Kubernetes:
- background job processing
- event-driven consumers
- integrations that absorb bursty workloads
A simple decision guide
| Workload type | Better starting metric | Why |
|---|---|---|
| Stateless web API | CPU | Often tracks request pressure well enough |
| Memory-sensitive service | Memory | Prevents pods from staying overloaded even with low CPU |
| Request-heavy edge service | Custom request metric | Maps more directly to user traffic |
| Queue worker | External queue length | Measures backlog, not just resource burn |
The best metric is the one that matches what you care about. If your primary goal is low queue delay, scale on queue-related signals. If your primary goal is healthy request latency and CPU is a decent proxy, start there.
Creating Your First HPA Manifest
A basic HPA manifest is small, which is good news. The hard part usually isn’t YAML syntax. It’s knowing which fields are doing the critical work.

Here’s a simple example for a web app that scales on CPU:
apiVersion: autoscaling/v2
kind: HorizontalPodAutoscaler
metadata:
  name: web-app-hpa
spec:
  scaleTargetRef:
    apiVersion: apps/v1
    kind: Deployment
    name: web-app
  minReplicas: 2
  maxReplicas: 10
  metrics:
  - type: Resource
    resource:
      name: cpu
      target:
        type: Utilization
        averageUtilization: 60
What each field means
scaleTargetRef tells Kubernetes what to scale. In this example, the HPA controls a Deployment called web-app.
minReplicas is the floor. Kubernetes won't scale below that number, even when traffic is light. This allows you to protect baseline availability.
maxReplicas is the ceiling. It stops runaway scaling and forces you to think about cost and downstream limits like database capacity.
The metrics block defines the trigger. Here, the HPA tries to keep average CPU utilization near the target value. If actual usage rises above that target, Kubernetes adds replicas. If it falls below, Kubernetes can remove replicas.
For teams setting this up the first time, solid observability matters more than fancy YAML. This roundup of Kubernetes monitoring best practices is worth reviewing before you trust autoscaling in production.
What to check before you apply it
A few basics need to be in place:
- Requests must exist: HPA relies on resource requests for utilization-based decisions.
- Metrics must be available: without Metrics Server or the right metrics adapter, the HPA has nothing to act on.
- The workload should be horizontally scalable: if sessions, local files, or singleton behavior block scale-out, the manifest won't save you.
A quick visual walkthrough helps if you prefer seeing the moving parts in action:
How I explain the CPU target to new teammates
If you set CPU utilization to 60%, you are not saying each pod must always sit at exactly 60%.
You’re saying, “when the fleet runs hotter than this on average, add pods so the work gets spread out.” That’s a control target, not a hard throttle.
Comparing HPA with Other Kubernetes Scalers
A lot of confusion around autoscaling comes from mixing up three different tools that solve three different problems.
HPA, VPA, and Cluster Autoscaler do different jobs
HPA changes the number of pods.
VPA changes pod resource requests and limits.
Cluster Autoscaler changes the number of nodes in the cluster.
That sounds simple, but in practice teams still ask HPA to solve node shortages or expect VPA to handle burst traffic by itself.
| Autoscaler | What It Scales | Primary Goal | Works Well With |
|---|---|---|---|
| HPA | Pod count | Match replica count to changing workload demand | Cluster Autoscaler |
| VPA | Pod CPU and memory requests or limits | Right-size individual pods | Selected steady workloads |
| Cluster Autoscaler | Node count | Add or remove cluster capacity | HPA |
How they fit together
The classic pairing is HPA plus Cluster Autoscaler. HPA decides that your app needs more pods. If the cluster has no room, the Cluster Autoscaler adds nodes so those pods can run.
That relationship matters for cost control. If you only scale pods but keep a large pool of underused nodes around, you won't get the full savings. If you only scale nodes but never adjust replicas, your app may still struggle under load.
For a useful breakdown of the infrastructure side, this guide to the cluster auto scaler helps clarify where node-level scaling starts.
When to be careful with VPA
VPA is useful, but not always a clean match for fast-changing front-end traffic. If a workload benefits from adding more copies quickly, HPA is often the more natural fit.
Don't treat autoscalers as substitutes when they're actually layers.
For many production platforms, the healthy pattern looks like this: HPA handles app elasticity, Cluster Autoscaler handles cluster capacity, and VPA is used selectively where right-sizing matters more than burst response.
Best Practices for Effective Pod Autoscaling
Most HPA incidents aren't caused by Kubernetes bugs. They come from poor inputs. Bad requests, weak metrics, or unrealistic scaling bounds make the controller act on flawed information.
Start with resource requests that reflect reality
If CPU requests are too low, utilization percentages look artificially high and HPA can scale aggressively. If requests are too high, utilization can look deceptively low and scaling may lag.
Treat requests as a measurement baseline, not a guess you set once and forget.
- Use actual workload behavior: base requests on observed usage from production-like traffic.
- Review after releases: a code change can shift resource patterns even if traffic stays flat.
- Separate requests from limits thoughtfully: they serve different scheduling and runtime purposes.
Prevent noisy scaling behavior
Rapid scale up and down is called flapping. It wastes money, churns pods, and can make the app less stable instead of more stable.
A few habits help:
- Keep
minReplicasrealistic so the app doesn't shrink to a fragile baseline. - Set
maxReplicaswith downstream systems in mind because your app may scale faster than your database or API dependencies. - Use stabilization settings and scaling behavior when your workload has short bursts.
- Prefer metrics that track user pain directly instead of whichever metric is easiest to wire up.
A stable HPA is usually a boring HPA. That’s what you want.
Use more than one signal when needed
Some workloads don't fit a single-metric model. A web service might need CPU as one input and request rate as another. A worker service may benefit from queue depth plus a floor on replica count.
That extra effort pays off because HPA becomes closer to the actual operating conditions of the service.
Common mistakes I see on real teams
minReplicasset too low: the app scales down nicely in charts, then cold starts hurt users.maxReplicasset too high: one spike fans out into a larger bill than expected.- No load testing: scaling policies look fine on paper but fail under bursty traffic.
- CPU-only thinking: not every bottleneck is compute.
When HPA feels unpredictable, don't start by blaming autoscaling. Start by checking whether the target metric represents demand and whether the workload can scale horizontally without hidden bottlenecks.
How HPA Impacts Cloud Costs and When to Use Other Tools
HPA helps you stop paying for peak pod count all day. That’s the obvious win. Instead of running an oversized deployment around the clock, you let Kubernetes add replicas when the workload needs them and remove them when it doesn’t.

But HPA only solves elastic demand. It doesn't solve predictably idle environments.
Your staging cluster at night isn't experiencing variable traffic. It's just not needed. In that case, scaling a deployment down to a small baseline is weaker than shutting the environment off on a schedule. That’s why cost-conscious teams combine autoscaling with scheduling strategies to control cloud costs effectively.
A simple explanation:
- Use HPA when the application must stay available and demand changes through the day.
- Use scheduled shutdowns when an environment is intentionally idle, like dev, QA, training, or after-hours staging.
If you're weighing scale-out against right-sizing and other cost tradeoffs, this comparison of horizontal vs vertical scaling adds useful context.
HPA manages workload demand. Scheduled shutdowns manage business demand. The best savings plan usually needs both.
If your team wants to cut spend from idle non-production infrastructure, CLOUD TOGGLE gives you a practical way to schedule shutdowns across cloud environments without relying on manual reminders or broad cloud-console access. Use HPA for live workload elasticity, and use CLOUD TOGGLE when whole servers or environments shouldn't be running.