At 3 PM on a Friday, nobody wants to hear that the app is timing out and the database is “probably the problem.” Yet that’s still how many teams monitor SQL Server. They wait for users to complain, open Activity Monitor, run a few familiar queries, and try to reconstruct what happened after the fact.
That approach fails for two reasons. First, most SQL Server problems don’t start as outages. They start as drift. A query plan changes, a table grows, statistics go stale, disk latency creeps up, or a test environment stays powered on all weekend in the cloud. Second, reactive troubleshooting gives you almost no business advantage. You might restore service, but you won’t build confidence, improve reliability, or cut waste.
If you want to monitor SQL Server well in 2026, treat monitoring as an operating discipline, not a dashboard project. Good monitoring tells your DevOps team four things early: what normal looks like, what changed, what matters to users, and what costs money when nobody’s looking.
Why Proactive SQL Server Monitoring Matters
Reactive database support feels busy, but it’s not controlled. A support ticket arrives, CPU is high, users are blocked, and every minute of confusion raises pressure on the ops team and the business. In that moment, you’re not tuning. You’re improvising.
Proactive monitoring changes the job. Instead of asking “what broke,” you ask “what moved away from baseline, when, and why.” That shift matters because SQL Server rarely fails without leaving a trail. Wait stats change. Batch activity changes. Query duration changes. Agent jobs start missing schedules. Storage growth stops being gradual and starts becoming a risk.
What good monitoring actually gives you
A solid monitoring strategy creates value well beyond firefighting:
- Earlier detection: You catch sustained pressure before users feel it.
- Cleaner diagnosis: You can separate a database issue from an app issue, infrastructure issue, or network issue.
- Capacity planning: You stop guessing when to add CPU, memory, or storage.
- Change validation: You can see whether a deployment improved things or made them worse.
- Cost control: You can identify systems that are healthy but idle, especially in cloud dev, test, and staging environments.
Practical rule: If your monitoring only becomes useful after users complain, you don’t have monitoring. You have forensics.
This is the same operating mindset behind broader proactive IT practices. Nutmeg Technologies’ guide to proactive business IT frames the larger point well. Teams run better when they prevent disruption instead of normalizing it.
For SQL Server specifically, that means collecting telemetry continuously, preserving history, and giving your team a shared view of health. Even a lightweight setup can make a big difference if it tracks the right signals and stores them long enough to compare today with last week. If you want a cloud-focused starting point for that mindset, this cloud server monitoring overview is useful for thinking about server health alongside operating costs.
What doesn’t work
Three habits keep teams stuck in reactive mode:
- Checking only host metrics: CPU and memory matter, but they don’t explain query plans, waits, blocking, or stale stats.
- Looking only at real-time views: A snapshot helps during an incident, but trends explain incidents.
- Alerting on everything: Noisy alerts train people to ignore the monitoring system.
The practical goal is simple. Build enough visibility that a bad Friday becomes an ordinary alert on a Wednesday morning.
Defining Your Monitoring Goals and KPIs
The fastest way to waste time with SQL Server monitoring is to collect metrics that nobody can act on. “CPU is high” isn’t a goal. “Order entry stays responsive during business hours” is a goal. “Nightly ETL finishes before users arrive” is a goal. “Staging databases don’t burn cloud budget when idle” is a goal.
The KPI set should come from those operating requirements. Start with user-facing outcomes, then map them to SQL Server behavior. That gives the DevOps team something more useful than a generic list of counters.
Start with business questions
Use these prompts before you choose tools:
- User experience: Which workflows slow down first when the database is under pressure?
- Reliability: Which jobs, integrations, or reports must complete on schedule?
- Change risk: Which deployments often affect query performance?
- Cost: Which environments can tolerate scheduled downtime when there’s no load?
That translation step matters because two SQL Server instances can have identical CPU usage and completely different operational risk.
The KPI set that earns its place
One of the most important workload indicators is Batch Requests/sec. Microsoft’s guidance around SQL Server KPIs identifies it as a primary measure of throughput, and healthy systems often sustain 100 to 1000+ batch requests/sec depending on hardware and query complexity. That same guidance also points to SQL Compilations/sec as a companion metric, because compilations above 10% of batch requests can indicate plan cache thrashing. See Microsoft’s SQL Server KPI guidance for Batch Requests/sec.
That metric matters because it helps you distinguish between “the server is busy” and “the server is inefficiently busy.”
Other KPIs belong in the initial baseline too:
- Page Life Expectancy: Useful for spotting memory pressure trends.
- Buffer Cache Hit Ratio: Helpful as a broad signal of cache effectiveness.
- Wait statistics: Better than CPU alone for understanding where time is going.
- Query duration and regression history: Necessary when performance changes after code or data changes.
- Statistics freshness: Important because bad row estimates drive bad plans.
Mapping common problems to SQL Server KPIs
| Common Complaint | Primary KPI to Investigate | Potential Cause |
|---|---|---|
| The app feels slow across many screens | Batch Requests/sec | Throughput spike, inefficient query patterns, or plan cache churn |
| Queries suddenly got slower after a deployment | Query duration history and statistics freshness | Regressed plan, stale statistics, or changed data distribution |
| The server looks busy but users report inconsistent slowness | Wait statistics | Blocking, I/O pressure, parallelism issues, or memory pressure |
| Reads are increasing and cache feels less effective | Page Life Expectancy and Buffer Cache Hit Ratio | Memory pressure or a workload shift |
| Writes are slower than expected | Waits plus index activity | Extra index maintenance cost or blocking |
| A cloud SQL VM costs too much outside business hours | Batch activity over time | Idle windows suitable for scheduling or shutdown |
Monitor KPIs in pairs, not in isolation. Throughput without compilations can hide plan cache issues. CPU without waits can send you toward the wrong root cause.
Baselines matter more than thresholds alone
Thresholds help, but baselines make them meaningful. Capture normal patterns across business hours, maintenance windows, and batch periods. A SQL Server supporting month-end reporting shouldn’t share the same alert assumptions as a lightly used internal app.
The best KPI set is the one your team will review, understand, and use to make decisions. If a metric doesn’t change actions, remove it from the front page.
Using SQL Server's Built In Telemetry
Organizations often possess more monitoring capability than they actively utilize. SQL Server ships with enough native telemetry to answer the majority of performance questions if you know where each tool fits.
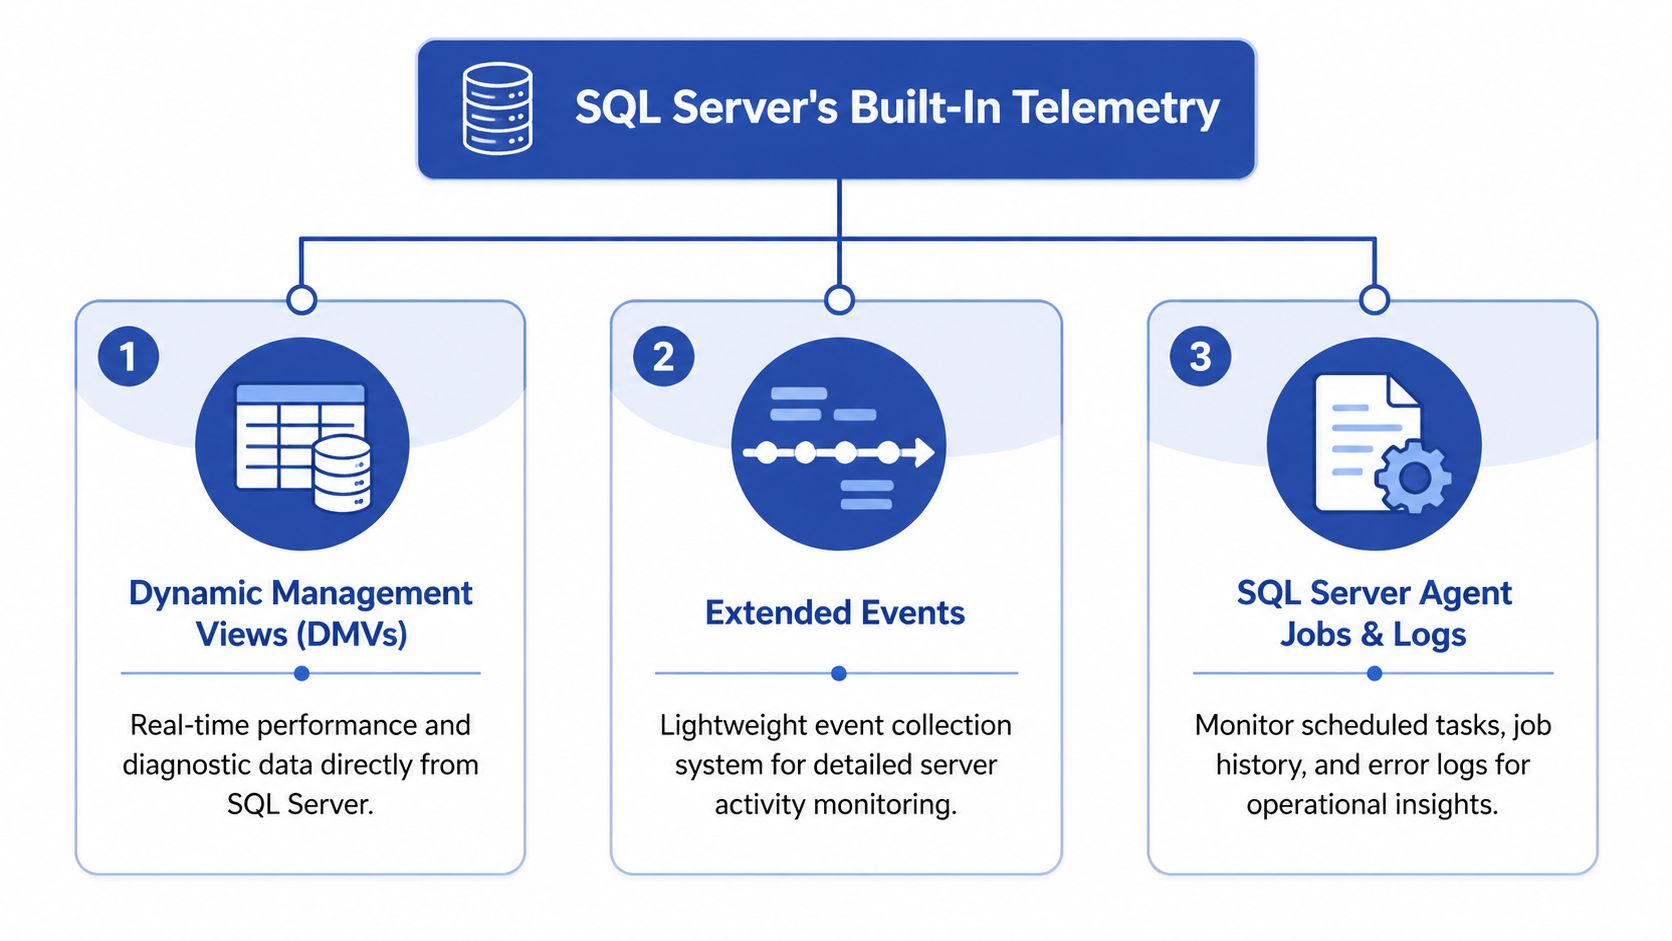
Use DMVs for fast operational answers
Dynamic Management Views, or DMVs, are the first place to look when something feels off right now. They’re direct, available, and good for live diagnostics.
A few DMV patterns deserve permanent use:
- Top resource-consuming queries
- Current waits and request state
- Index usage
- Statistics health
- File and I/O activity
For example, query-level performance history from sys.dm_exec_query_stats is good for finding expensive statements:
SELECT TOP (20)
    qs.execution_count,
    qs.total_worker_time,
    qs.total_elapsed_time,
    qs.total_logical_reads,
    qs.last_elapsed_time,
    SUBSTRING(st.text,
        (qs.statement_start_offset/2) + 1,
        ((CASE qs.statement_end_offset
            WHEN -1 THEN DATALENGTH(st.text)
            ELSE qs.statement_end_offset
        END - qs.statement_start_offset)/2) + 1) AS statement_text
FROM sys.dm_exec_query_stats qs
CROSS APPLY sys.dm_exec_sql_text(qs.sql_handle) st
ORDER BY qs.total_worker_time DESC;
For wait analysis during live issues:
SELECT TOP (20)
    wait_type,
    waiting_tasks_count,
    wait_time_ms,
    signal_wait_time_ms
FROM sys.dm_os_wait_stats
WHERE wait_type NOT LIKE 'SLEEP%'
ORDER BY wait_time_ms DESC;
For index usage review:
SELECT
    DB_NAME(database_id) AS database_name,
    OBJECT_NAME(i.object_id, i.database_id) AS object_name,
    i.index_id,
    user_seeks,
    user_scans,
    user_lookups,
    user_updates
FROM sys.dm_db_index_usage_stats i
WHERE database_id = DB_ID()
ORDER BY user_updates DESC;
Use Query Store for performance regressions
Query Store changed SQL Server troubleshooting because it preserves query performance history across time. That makes it far easier to answer the hardest production question: what changed?
Microsoft’s SQL Server statistics documentation notes that Query Store, available from SQL Server 2016, enabled regression detection with persistent query performance data and helped reduce plan choice errors by up to 40% in production workloads. The same documentation also points to sys.dm_db_stats_properties as a key DMV for checking last_updated and modification_counter in statistics management. See Microsoft’s statistics and Query Store documentation.
That connection matters in practice. Query Store tells you which query regressed. Statistics checks help explain why.
A simple statistics health check:
SELECT
    OBJECT_NAME(s.object_id) AS table_name,
    s.name AS stats_name,
    sp.last_updated,
    sp.modification_counter
FROM sys.stats s
CROSS APPLY sys.dm_db_stats_properties(s.object_id, s.stats_id) sp
ORDER BY sp.last_updated ASC;
If a query slows down after data shape changes, check statistics before you redesign indexes or rewrite application code.
Use Extended Events when you need precision
Extended Events are the right tool when you need to capture a specific behavior with less overhead than old Profiler-style tracing. Use them for deadlocks, long-duration queries, login issues, severe errors, or a targeted event session around a suspected pattern.
Typical uses include:
- Deadlock capture
- Long-running statement tracking
- Error severity monitoring
- Blocking investigation
Teams commonly overdo it. Don’t create a giant catch-all session and leave it running forever. Create focused sessions for focused questions.
Put native telemetry somewhere people can use it
The biggest weakness of built-in telemetry isn’t lack of detail. It’s lack of consolidation. DMVs reset on restart, Query Store needs governance, and Extended Events need a destination your team can access. A central analytics workspace helps when you want SQL telemetry to sit next to infrastructure and application signals. For teams evaluating that pattern, this log analytics workspace guide is a useful operational reference.
A practical split works well:
- DMVs for immediate inspection
- Query Store for regressions and plan history
- Extended Events for targeted evidence
- Agent job history and logs for operational failures
That stack is usually enough to build a serious monitoring practice before you spend money on anything else.
Setting Up Performance Counters and Alerts
Monitoring data only matters if it reaches the right person before users feel the issue. That’s where counters and alerts come in. You’re building an early warning system, not a museum of metrics.
A common mistake is setting thresholds before understanding normal behavior. That produces alert fatigue fast. A baseline comes first. Then alerts.
Counters that deserve permanent attention
At the host and SQL Server level, a small set of counters usually covers most operational drift:
- Processor pressure: Watch sustained CPU patterns, not isolated spikes.
- Memory pressure: Pair SQL memory behavior with Page Life Expectancy.
- Disk latency and throughput: Especially important for write-heavy systems.
- SQL workload counters: Track throughput and supporting signs of inefficiency.
- Blocking and deadlocks: Catching these early prevents user-visible slowdowns.
Paessler’s guidance on SQL Server monitoring notes that proactive monitoring with baselines and alerts can reduce performance incidents by 40-60%. The same guidance says Page Life Expectancy should ideally be above 300 seconds for every 4GB of memory, and warns that ignoring historical baselining leads to 25% false positives in alerts. See Paessler’s SQL Server monitoring best practices.
Build alerts in layers
Don’t put every signal into the same severity bucket. That’s how teams end up treating all alerts as noise.
Use three layers instead:
Informational alerts
Use these for drift worth reviewing but not waking anyone up over. Examples include gradual storage growth, rising compilations, or statistics getting old on fast-changing tables.
Action alerts
These need intervention during working hours. Think sustained memory pressure, blocking patterns, repeated job failures, or sharply degraded query duration.
Urgent alerts
Reserve these for conditions with user impact or immediate risk. Examples include deadlocks repeating, transaction log pressure, severe errors, or an availability problem.
A useful alert answers three questions immediately. What changed, how bad is it, and who should act.
SQL Server Agent Alerts still matter
SQL Server Agent Alerts are underrated because they’re not flashy. They’re also dependable for operational problems that deserve immediate notification.
Set alerts for:
- Specific error numbers: Useful for recurring failure patterns your team already understands.
- Severity levels: Good for broad safety coverage.
- Job failures: Especially on backup, ETL, import, and maintenance jobs.
- Space and log-related conditions: These are preventable problems that still cause too many incidents.
The practical win is calmness. When alerts are based on real baselines and tied to clear runbooks, on-call work becomes much more predictable.
Building Dashboards and Diagnosing Issues
Dashboards earn their keep when they reduce decision time. They fail when they turn into decorative wallpaper. A useful SQL Server dashboard starts high-level, then makes drill-down easy enough that the person on call doesn’t need to hunt across five tools.

An effective dashboard usually combines three views:
- Service view: Is the database healthy from an application perspective?
- Resource view: Are CPU, memory, storage, and waits aligned or in conflict?
- Workload view: Which queries, jobs, or code paths changed behavior?
SSMS reports can help for small environments. Power BI works well when teams want custom trend reporting. Azure Monitor and other centralized platforms are useful when SQL Server is only one part of a bigger operational picture. Grafana can be excellent if you already have a metrics culture and want flexibility. This comparison of Datadog vs Grafana for observability teams is a helpful way to think through dashboard trade-offs.
A real diagnostic flow for high CPU
A common alert arrives like this: CPU is high, response times are climbing, and nobody knows whether the problem is SQL Server, the app, or the infrastructure.
Start at the dashboard.
If CPU is high but batch activity is flat, the issue may be a small number of expensive queries rather than a broad workload spike. If waits lean toward I/O, CPU may be a secondary symptom. If job history shows an index maintenance or ETL task started at the same time, your answer may have nothing to do with the application release everyone is blaming.
Then drill into Query Store and DMVs:
Confirm the time window
Match the alert time to the query duration spike.
Find regressed queries
Look for statements with higher elapsed time, reads, or CPU than their normal pattern.
Check execution plan changes
If the plan changed, compare the old and new version before touching indexes.
Review statistics health
On volatile tables, stale stats are often the quiet trigger behind a “sudden” slowdown.
Check blocking and waits
A CPU alert can still begin with blocking pressure or poor parallelism choices.
Unused indexes deserve a place on the dashboard
Index monitoring is where snapshots often mislead people. sys.dm_db_index_usage_stats is a strong starting point, but by itself it only shows activity since restart and doesn’t give you historical context. That’s why many teams keep indexes they no longer need.
The SQLSkills guidance on index usage highlights the need for historical tracking, and the related verified data notes that 52% of monitored production instances have unused indexes, which can contribute to query slowdowns. See Paul Randal’s index usage discussion on SQLSkills.
That should change how you think about indexes in monitoring. They aren’t just performance helpers. They’re also write overhead, storage overhead, and maintenance overhead.
Don’t drop an index because it looks unused today. Track it across business cycles, reporting windows, and maintenance periods first.
For teams that troubleshoot wider infrastructure symptoms alongside database issues, network visibility matters too. A slow SQL query and a slow path between app and database can look similar to users. Constructive-IT’s piece on minimising network downtime is a good reminder that end-user slowness often spans layers.
A practical walkthrough helps when you want to see this sort of investigation in action:
The dashboard’s job isn’t to replace DBA judgment. It’s to shorten the path from symptom to likely cause.
From Monitoring to Cloud Cost Optimization
SQL Server monitoring transcends an operations discipline, also functioning as a budget control mechanism.
Organizations already collect enough data to find waste. They just don’t connect that telemetry to cloud spend decisions. A SQL Server instance that performs well but sits idle for long periods is still costing money. In cloud environments, that’s an operations issue and a FinOps issue at the same time.

The metrics that expose idle cost
You don’t need exotic telemetry to find scheduling opportunities. The useful signals are already familiar:
- Batch activity over time: Tells you whether the instance is doing meaningful work.
- CPU utilization trend: Confirms whether low query load also means low host activity.
- Connection patterns: Helpful for spotting environments that only matter during office hours.
- Job schedules: Prevents accidental shutdowns during maintenance, ETL, or backup windows.
- Query latency during active periods: Confirms that right-sizing or scheduling won’t hurt users.
The important distinction is between underused and intentionally reserved. Production systems may stay on for availability reasons. Dev, test, QA, training, and some staging systems usually don’t.
Why this matters to the business
ManageEngine’s SQL Server monitoring topic cites a 2025 FinOps Foundation report saying databases account for 25-30% of cloud bills in midsize businesses due to overprovisioning, with 40% idle time undetected without cost-aware monitoring. The same verified data notes potential savings of over $50K annually per 100 instances when monitoring data is used to trigger shutdown schedules. See the ManageEngine SQL Server monitoring discussion.
That’s the gap many DevOps teams still leave open. They monitor for health, but not for idle cost. They alert when a server struggles, but not when a server does nothing for long stretches while billing continues.
What works in practice
A practical FinOps-aware SQL Server routine looks like this:
Baseline activity by environment
Separate production from non-production first. Then chart business-hour versus off-hour usage.
Find reliable idle windows
Use workload history, not assumptions. If a server has repeated low activity overnight and on weekends, validate that against job schedules and owner expectations.
Classify by shutdown safety
Some systems can be scheduled aggressively. Others need manual approval or an override process.
Give non-DBA stakeholders visibility
Engineering managers, app owners, and finance stakeholders don’t need DMV detail. They need evidence that a server is idle and safe to schedule.
Measure savings after policy changes
If teams can see the reduction in idle runtime, they’ll support the discipline instead of resisting it.
The same monitoring stack that protects performance can also identify waste. That’s one of the highest-value operational habits a cloud team can build.
What usually goes wrong
Cost optimization fails when teams do one of two things. They either schedule blindly without understanding workload patterns, or they never schedule anything because they treat every SQL Server like a production system.
Both mistakes come from weak visibility. Good SQL Server monitoring gives you the evidence to be selective. That means fewer unnecessary runtime hours, fewer arguments about risk, and a more credible operations team.
If you want to turn SQL Server monitoring data into scheduled cloud savings without handing out broad cloud-console access, CLOUD TOGGLE is built for that use case. It lets teams automate power schedules across AWS and Azure, apply role-based access, and give non-engineers a safe way to participate in cost control. That’s useful when you’ve already identified idle SQL workloads and need a practical way to act on them.