At its core, a Log Analytics Workspace is your central command center in Azure for all things data. It's a dedicated environment where you collect, combine, and analyze log and performance data from all your cloud and on-premise resources.
Think of it as the single source of truth for your entire operation.
The Foundation of Cloud Observability
Imagine trying to diagnose a complex server issue by sifting through dozens of separate log files. You'd be overwhelmed by the noise, trying to piece together a story from scattered clues. A Log Analytics Workspace solves this by acting as a central diagnostic hub.
It pulls all that operational data together from your apps, VMs, and services and organizes it in one place. This is exactly why a workspace is the engine behind powerful tools like Azure Monitor for performance tracking and Microsoft Sentinel for security. Without the workspace, these services would have no data to work with.
Transforming Data into Intelligence
The real goal of a Log Analytics Workspace is to turn mountains of raw log entries into clear, actionable answers. It gives you a structured environment to do three critical things:
- Collect Data: Pull in logs, metrics, and events from virtually any source. This includes Azure services, virtual machines, and even apps running in other clouds or your own data center.
- Aggregate Information: Merge different data streams into one cohesive picture. You can finally correlate an application performance log with an infrastructure metric to find the root cause of a problem in minutes, not hours.
- Analyze with KQL: Use the Kusto Query Language (KQL) to ask detailed questions, hunt for specific events, spot trends, and build out reports.
This capability is no longer a luxury; it's a core business need. The global log management market is a testament to this, growing from USD 2.3 billion in 2021 and projected to hit USD 4.1 billion by 2026. This rapid growth, detailed in research from MarketsandMarkets, shows just how critical these tools have become.
A Log Analytics Workspace lets you move beyond simple monitoring. Instead of just knowing if a server is down, you can find out why it went down, what other systems were impacted, and how you can stop it from happening again.
To better understand its structure, let's look at the essential components that make a workspace function.
Log Analytics Workspace Core Components
Here’s a quick breakdown of the key parts and what they do.
| Component | Function |
|---|---|
| Data Sources | The various resources that send data, like VMs, applications, and Azure services. |
| Data Ingestion API | The endpoint that receives and processes all incoming log and metric data. |
| Tables | The structured containers within the workspace where specific data types are stored. |
| Kusto Query Language (KQL) | The powerful query language used to search, filter, and analyze the data stored in the tables. |
| Azure Monitor Integration | The connection that powers alerting, dashboards, and automated responses based on query results. |
These components work together to provide a seamless flow from raw data collection to deep, insightful analysis.
Ultimately, by turning raw data into real insights, a workspace helps you stay ahead of system health issues, strengthen your security, and optimize performance across your entire tech stack. It's the essential first step toward achieving genuine observability in your environment.
How Data Flows Through Your Workspace
To really master your Log Analytics Workspace, you first have to understand how data actually moves through it. Think of it less like a simple database and more like a sophisticated data refinery. Raw, messy data goes in one end, and clean, queryable insights come out the other.
It all starts with your data sources. These can be anything and everything: applications, infrastructure, virtual machines, or any other Azure service. Each one is constantly generating a flood of operational data, from raw logs to performance metrics and event details. This is the starting point of our journey.
The Azure Monitor Agent: Your Data Courier
The first step is getting all that scattered data into one place. This is the job of the Azure Monitor Agent. Think of it as a dedicated courier that collects data "packages" from all your designated sources and ships them off to the workspace. It’s the essential link that brings order to a potentially chaotic environment.
This simple diagram gives you a high-level view of the entire process, from the initial data source all the way to an actionable insight.
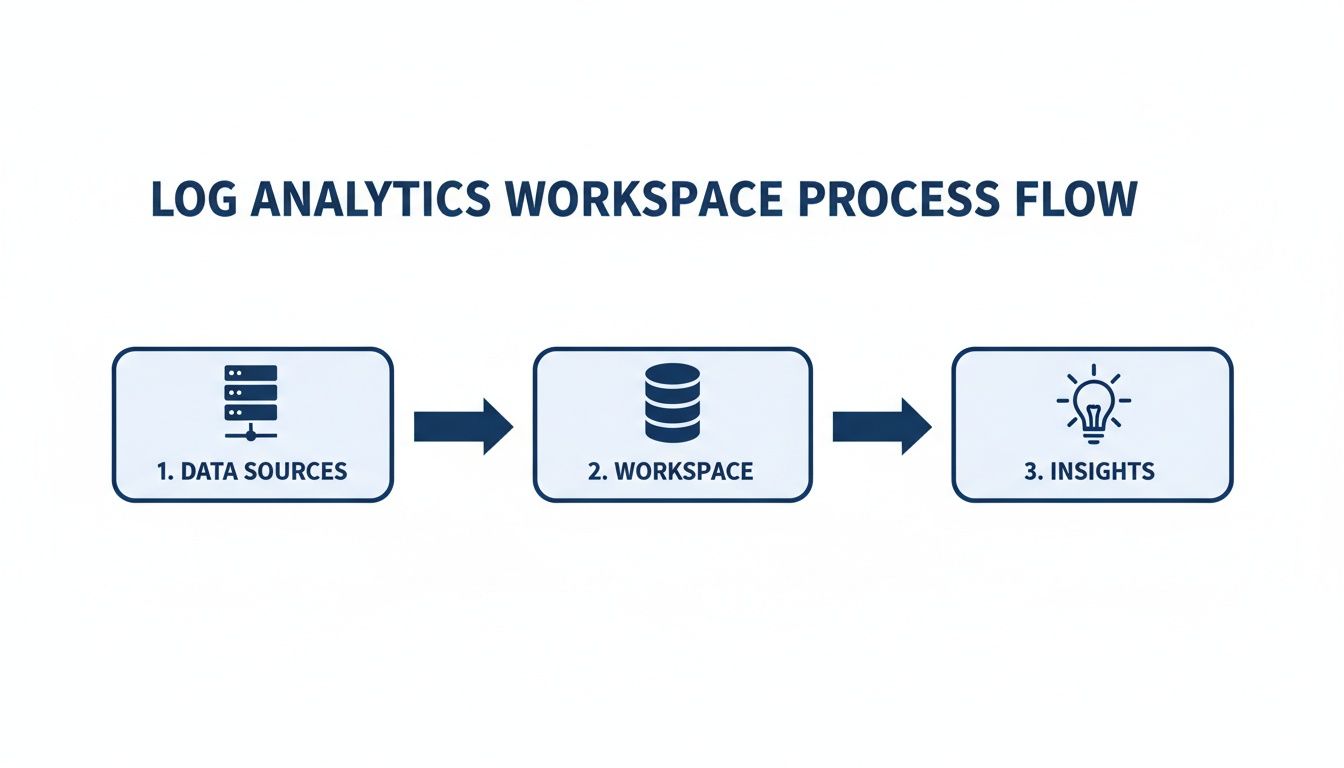
As you can see, the flow is broken down into three core stages: collecting the data, processing it in the workspace, and finally turning it into something you can act on.
The Ingestion Pipeline: Turning Chaos into Order
Once the Azure Monitor Agent sends the data, it hits the ingestion pipeline. This isn't just a doorway; it's a powerful processing engine that gets the data ready for analysis. Here’s what happens under the hood:
- Parsing: The pipeline takes the raw log data, which can arrive in dozens of different formats, and breaks it down into a consistent, structured format.
- Indexing: After parsing, the data gets indexed. This works just like the index in a book, making it incredibly fast to search and query millions of records in seconds.
- Transformation: This is where you can apply Data Collection Rules (DCRs). These rules let you filter out noisy, irrelevant data or even add extra context before the data is stored. It’s a great way to manage costs and make your queries run faster.
The ingestion pipeline is the critical translator that turns a chaotic mix of logs into a well-organized library. Without this step, searching for information would be slow, difficult, and inefficient.
Stored and Ready for Queries
After the data is parsed, indexed, and transformed, it lands in specific tables inside your Log Analytics Workspace. Each table is built to hold a certain type of data, like performance counters, security events, or custom application logs. This organization is what makes analysis possible.
This structured storage is what lets you use the Kusto Query Language (KQL) to ask incredibly detailed questions of your data and get answers back almost instantly. This entire journey from raw event to query-ready table is what makes a Log Analytics Workspace so powerful for anyone serious about monitoring in the cloud.
Getting Started: Your First Log Analytics Workspace
Alright, let's move from theory to action and get your first Log Analytics Workspace set up. This is where the rubber meets the road. I'll walk you through creating and configuring the resource right inside the Azure portal, showing you exactly how to create the workspace, link it to the right subscription, and place it in the correct resource group and region.
Think of this like setting up analytics on a new website; you're building the foundation to gather crucial data. The good news is that creating a workspace in Azure is surprisingly quick and only takes a few steps.
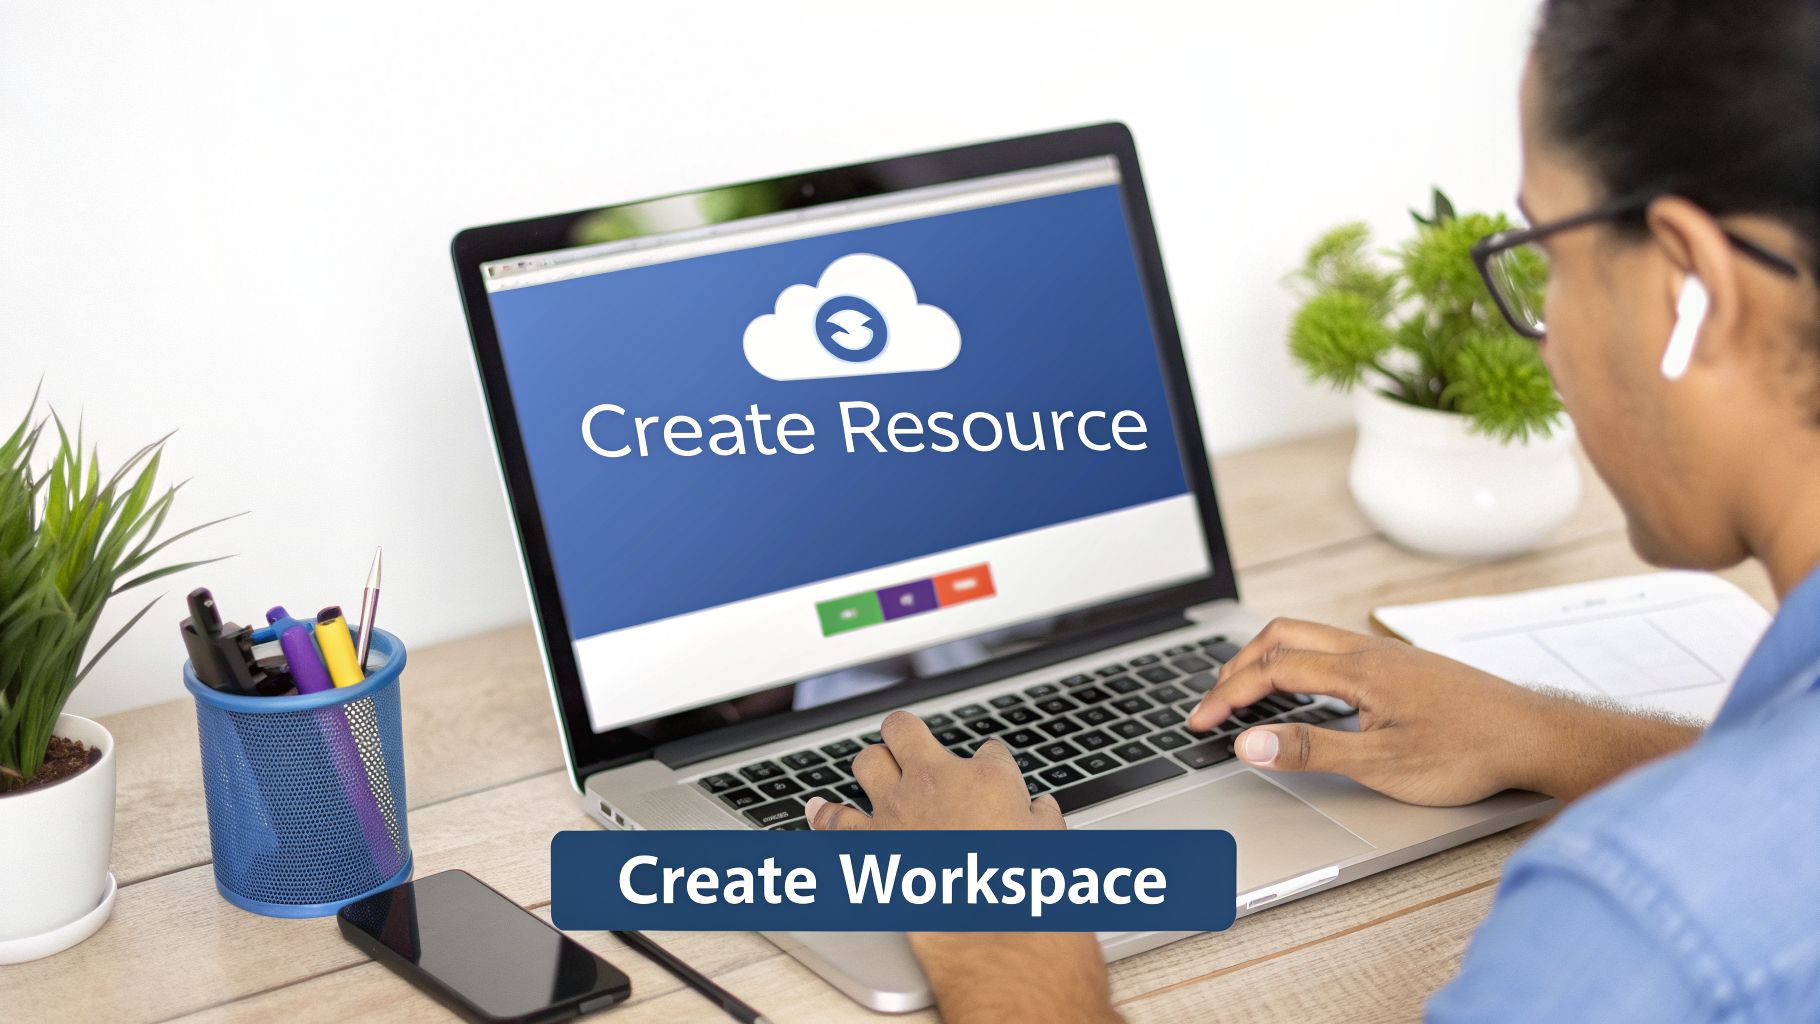
Creating Your Workspace Step by Step
Let's dive in. The process is straightforward, even if you're new to Azure's monitoring services.
- Find Log Analytics Workspaces: In the Azure portal's search bar, just type "Log Analytics workspaces" and select it from the list of services.
- Create a New Workspace: Hit the "Create" button. This will kick off the setup wizard and take you to the main configuration page.
- Fill Out the Basics: You'll need to provide a few key details to get started.
- Subscription: Pick the Azure subscription you want to bill this workspace to.
- Resource Group: You can either select an existing resource group or create a new one to keep your resources organized.
- Name: Give your workspace a unique name that makes sense to you and your team.
- Region: Select the Azure region where your workspace will live. It’s a good practice to choose the same region as the resources you're monitoring to keep latency down.
These first few steps are just about laying the groundwork. The real magic happens in the next set of decisions, where you can fine-tune the setup for your specific needs, especially around cost and data availability.
Making the Right Configuration Choices
The choices you make here will directly impact your monthly bill and how you can access your data. Pay close attention to the pricing tier and data retention policies; these are your main levers for managing operational costs effectively.
Your pricing tier and retention settings aren't just one-time setup options. They are the primary controls you have for reining in your Log Analytics spending. Getting them right from the start is the best way to avoid a surprise bill.
The need for better log management tools is exploding. In fact, the log management market was valued at USD 818.7 million back in 2025 and is only expected to grow. This just goes to show how critical it is for businesses to get a handle on the massive amounts of data pouring out of their cloud services.
Connecting Your First Data Source
With your workspace created, the final step is to start sending it some data. You won’t see anything happen until you connect a data source. A great place to start is with an Azure Virtual Machine (VM).
To do this, just navigate to your new Log Analytics Workspace, find the "Agents" section, and follow the instructions to install the Azure Monitor Agent on your VM. This agent is the courier that collects logs and performance data, sending it straight to your workspace.
Once it's connected, you can start running queries and see data flowing in almost immediately. For more complex setups where you need to manage permissions, you might need to use a service principal. If you're new to that, don't worry, you can learn more about creating a service principal in our guide.
Finding Insights with Kusto Query Language
So, your Log Analytics Workspace is collecting data. That’s a great first step, but just having the data isn't the point. The real payoff comes when you start asking it the right questions.
This is where the Kusto Query Language (KQL) comes into play. Think of it as a specialized search engine for all the log and telemetry data you've gathered. KQL is how you cut through the noise, spot trends, and find actionable answers buried in millions of events. With just a few lines of code, you can uncover hidden issues and find direct opportunities to save money.
These insights are what build true data observability across your entire cloud environment.
Find Idle Servers and Cut Cloud Costs
One of the quickest wins you can get from Log Analytics is identifying waste. Idle virtual machines are a classic example of unnecessary cloud spend; they're running and costing you money but doing no useful work.
We can query the Heartbeat table, which simply tracks if the Azure Monitor Agent is running, to find servers that are online but not actually busy. This query looks for any servers that sent a heartbeat but had a CPU utilization of less than 5% over the last 24 hours.
// Find servers with low CPU usage over the last 24 hours
Heartbeat
| where TimeGenerated > ago(24h)
| summarize last(TimeGenerated) by Computer
| join kind=inner (
Perf
| where TimeGenerated > ago(24h)
| where CounterName == "% Processor Time" and InstanceName == "_Total"
| summarize avg(CounterValue) by Computer
) on Computer
| where avg_CounterValue < 5
| project Computer, avg_CounterValue
How This Query Works:
- It starts with the
Heartbeattable and filters for machines that have been active in the last 24 hours. - Then, it gets a unique list of computers from that data.
- Next, it joins that list with performance data from the
Perftable, specifically looking for the total CPU processor time. - It calculates the average CPU usage for each machine over that period.
- Finally, it filters the results to show only those machines with an average CPU usage below 5%.
The output gives you a simple, actionable list of servers that are likely idle. From here, you can investigate them for shutdown and start saving money almost immediately.
Analyze Data Ingestion Costs
Another powerful use for KQL is getting a handle on your Log Analytics costs. Your bill is mostly driven by the amount of data you're sending to the workspace. The Usage table is your friend here, as it contains detailed information on data volumes from every source.
This query digs into the Usage table to show which data types are contributing the most to your monthly bill.
// Analyze data ingestion volume by data type over the last 30 days
Usage
| where TimeGenerated > ago(30d)
| where IsBillable == true
| summarize IngestedGB = sum(Quantity) / 1000 by DataType
| order by IngestedGB desc
With KQL, you're no longer guessing where your money is going. This simple query instantly reveals which logs are costing the most, allowing you to create data collection rules to filter out non-essential data and optimize your spend.
By learning just a little KQL, you turn your Log Analytics Workspace from a passive data bucket into an active intelligence tool that drives real financial and operational decisions.
Turn Analytics into Automated Cost Savings
Finding idle servers with a KQL query is a powerful first step, but the real value comes from turning that insight into action. A list of underused resources is only useful if you do something with it. This is where you can bridge the gap between analytics and automation to drive real-world savings.
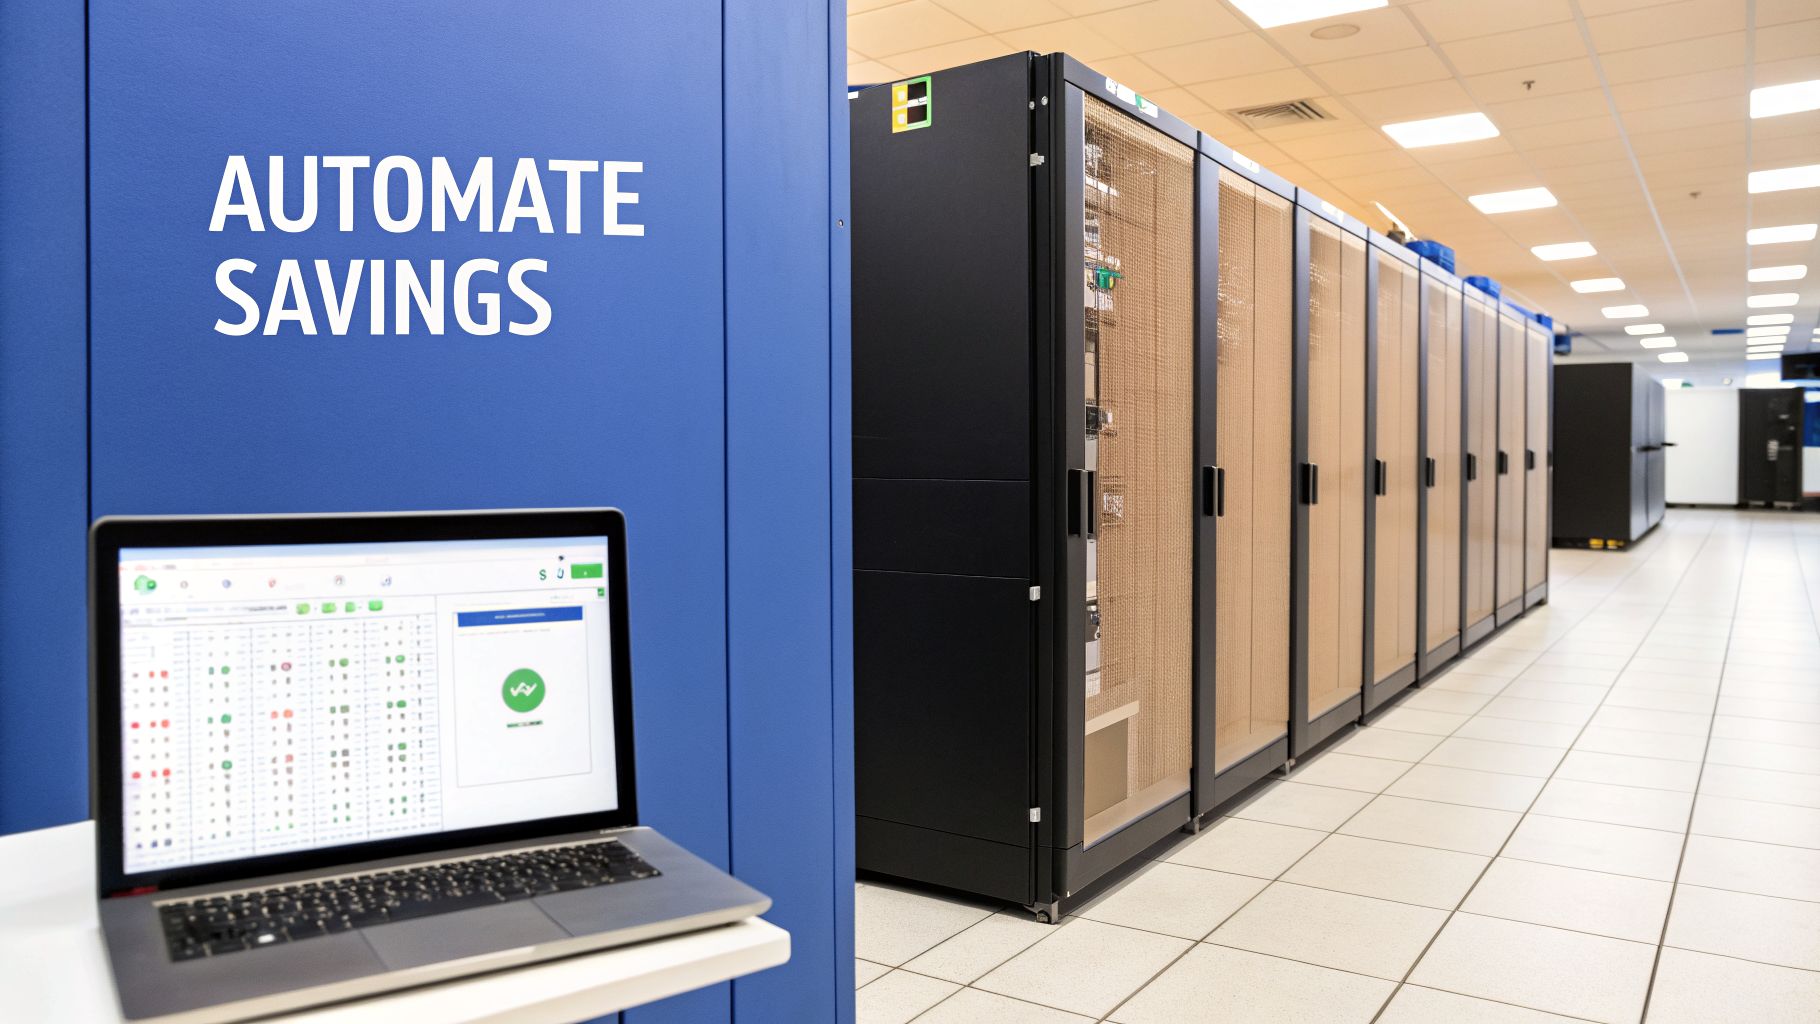
Think of it this way: your log analytics workspace tells you what is happening, but a tool like CLOUD TOGGLE gives you the how to act on it. It closes the loop by taking the list of idle servers from your KQL query and putting them on an intelligent, automated shutdown schedule. This is the key to unlocking the full financial potential of your log data.
From Insight to Action with Automation
Let's say your KQL query confirms that a group of development servers is consistently idle every night after 7 PM and all weekend. Instead of relying on someone to manually shut them down, you can use that data to build an automated schedule.
This is where a platform like CLOUD TOGGLE makes things incredibly simple. You can create a schedule that automatically powers down those specific servers at 7 PM on weekdays and keeps them off until 8 AM the next morning. This direct connection between log analysis and automated action ensures you are only paying for resources when they are actively being used.
By operationalizing the data from your log analytics workspace, you transform a reactive monitoring tool into a proactive cost-optimization engine. The data no longer just informs you; it actively works for you to reduce spend.
This approach is becoming critical as businesses worldwide adopt advanced analytics. The Asia-Pacific region, for instance, is the fastest-growing market for log management solutions, driven by a need to safeguard digital assets and manage expanding infrastructure. Getting the most from these powerful tools means moving beyond simple monitoring.
Simplifying Access for Everyone
One of the biggest hurdles to cloud cost control is that management tools are often complex, requiring deep technical expertise. This creates a bottleneck where only a few engineers can implement savings initiatives.
Automation platforms like CLOUD TOGGLE are designed with a secure, user-friendly interface that democratizes cost management. Non-technical team members, like project managers or financial analysts, can be granted permissions to manage schedules for their specific resources without needing access to the entire Azure environment. This distributed ownership empowers teams to manage their own cloud costs safely and effectively.
To dig deeper into this topic, you can read our guide on how automation in the cloud streamlines operations and reduces expenses. By combining the powerful analytics of your workspace with accessible automation, you create a sustainable system for continuous cloud savings.
A Few Common Questions About Log Analytics Workspaces
As you dive deeper into Azure, you'll start to see how all the different services connect. Let's clear up a few of the most common questions people have about Log Analytics Workspaces and how to use them effectively.
What's the Difference Between Azure Monitor and a Log Analytics Workspace?
It’s easy to get these two confused. Think of Azure Monitor as the big-picture brand for all things monitoring in Azure. It’s the umbrella that covers everything from dashboards and alerts to the tools you use to investigate issues.
A Log Analytics Workspace, on the other hand, is a specific, vital part of Azure Monitor. It’s the actual "database" where all your log data from across your environment gets collected, stored, and queried. You can't really use the analysis features of Azure Monitor without a workspace to hold the data first.
Can I Use One Workspace for Multiple Subscriptions?
Absolutely, and for most businesses, this is the way to go. You can point data sources from different Azure subscriptions, on-premise servers, and even other clouds to a single, centralized workspace. This approach pays off in a few key ways.
- Simplified Management: You have one place to manage all your monitoring data instead of juggling several.
- Unified View: It gives you a complete, holistic picture of your entire IT environment, which makes spotting trends and cross-system issues much easier.
- Easier Queries: Writing queries that span across different resources or subscriptions becomes incredibly straightforward.
A single, centralized Log Analytics Workspace gives you a powerful vantage point over your entire infrastructure. However, always consider data sovereignty rules, regional compliance, and internal access control policies when designing your workspace strategy.
For instance, a company with separate development, testing, and production subscriptions can funnel all their logs into one workspace. This lets a central operations team keep an eye on application health through every stage of the lifecycle, all from one dashboard.
How Can I Keep My Log Analytics Costs Under Control?
Cost is always a huge consideration. With a Log Analytics Workspace, your bill is mainly driven by two things: data ingestion (how much data you send in) and data retention (how long you keep it). The good news is, you have several knobs you can turn to manage these costs.
- Pick the Right Pricing Tier: If your data volumes are fairly predictable, a commitment tier can give you a much better per-gigabyte price than the standard pay-as-you-go model.
- Fine-Tune Data Retention: Set your retention period to what your business and compliance policies actually require. Storing data for 90 days is a lot cheaper than holding onto it for a year, especially if you rarely access older logs.
- Filter Out the Noise: Use Data Collection Rules (DCRs) to filter out verbose or low-value logs before they even hit your workspace. This is one of the most direct ways to cut ingestion costs.
- Analyze Your Usage: Every so often, run a KQL query against the
Usagetable. This will show you exactly which resources or data types are generating the most data, so you know where to focus your optimization efforts.
By actively managing these settings, you can make sure your Log Analytics Workspace delivers critical operational insights without breaking the bank.
Ready to turn those insights into automatic savings? With CLOUD TOGGLE, you can take the data from your Log Analytics Workspace and build intelligent shutdown schedules for your idle servers in minutes. Stop paying for resources you aren't using and see how much you can save with a free 30-day trial.