Azure Application Insights is a powerful Application Performance Management (APM) service that gives you a complete, real-time view of your live web applications. The best way to think of it is as a flight recorder for your software; it constantly captures performance data, helps you spot issues, and lets you diagnose problems to keep your users happy.
What Is Application Insights Azure And Why It Matters
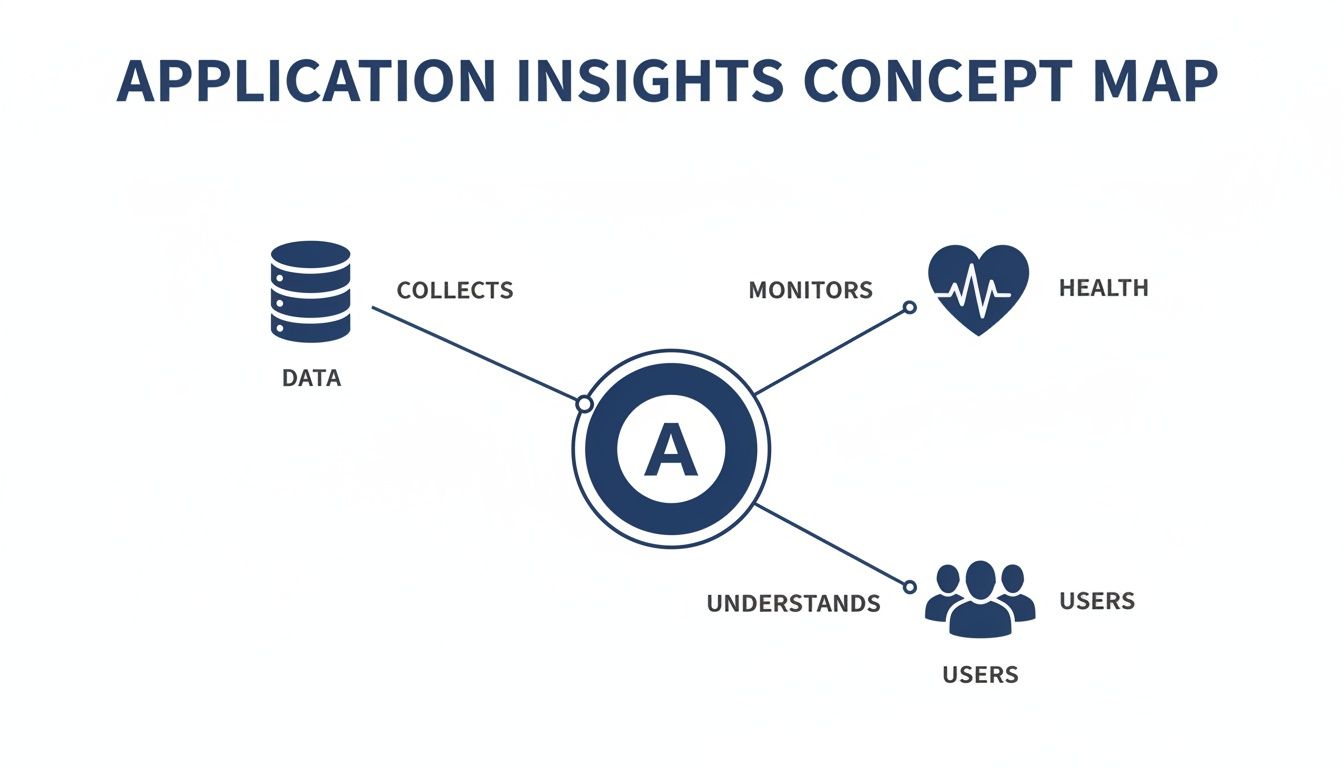
Imagine your application is a complex road network. User requests are cars, data flows are the highways, and different services are the connected towns. Without a central traffic control system, a single accident can cause a massive jam, and you'd have no idea where the problem even started.
Azure Application Insights is that city-wide monitoring system.
It gives you a live, interactive map of your entire application, so you're not just guessing where a slowdown or error is happening, you can see it. The service automatically gathers performance and failure data, known as telemetry, to tell the full story of your application's health.
The Application Map feature, shown below, is a perfect example of this. It visualizes how all the different pieces of your application talk to each other.
The map clearly shows dependencies between your services, along with call volumes, latency, and failure rates. This makes it incredibly easy to spot bottlenecks or failing components at a glance.
A Shift From Reactive To Proactive Monitoring
For too long, IT and DevOps teams have been stuck in a reactive "firefighting" mode. You wait for a user to complain, then scramble to fix the issue. This approach isn't just stressful; it can seriously damage your business's reputation.
Application Insights helps you break that cycle by enabling proactive management.
By turning abstract data into clear, actionable intelligence, Application Insights empowers teams to move from stressful, reactive problem-solving to strategic, proactive optimization. This shift isn't just a technical upgrade; it's a direct improvement to your bottom line.
Since its launch on April 8, 2015, the service has become a vital part of Microsoft's cloud monitoring toolkit. As Azure's own footprint has expanded, the need for a tool like Application Insights has grown with it. In fact, studies have shown that teams using it can reduce their mean time to resolution (MTTR) for production incidents by up to 50%. That's a huge improvement that directly impacts customer satisfaction and operational costs. You can explore more data on Microsoft Azure's market position and its industry impact.
This service is so important for modern software development because it connects your application's performance directly to your business goals.
Here's a quick look at how Application Insights provides a powerful overview of your application's health.
Application Insights At A Glance
The table below summarizes the key features and the primary benefits they deliver, helping you understand how it turns raw data into valuable insights for your team.
| Feature | Primary Benefit |
|---|---|
| Live Metrics | Watch real-time performance data to instantly see the impact of new deployments. |
| Application Map | Visualize dependencies to quickly identify bottlenecks and failure points. |
| Smart Detection | Get automatic alerts on performance anomalies before they affect users. |
| Distributed Tracing | Follow a single request across multiple services to find the root cause of issues. |
| Usage Analytics | Understand how users interact with your app to make data-driven decisions. |
Ultimately, each of these features works together to provide a holistic view that is crucial for building and maintaining reliable, high-performing applications.
- Improve User Experience: Quickly find and fix slowdowns, crashes, and other errors to make sure your users have a smooth, reliable experience.
- Reduce Downtime: Proactive alerts and deep diagnostic tools help you solve problems before they can cause major outages.
- Boost Developer Productivity: Instead of digging through mountains of log files, developers get the exact data they need to pinpoint the root cause of bugs fast.
At the end of the day, Application Insights turns monitoring from a simple technical chore into a genuine strategic asset. It gives you the clarity you need to build better, a more dependable software.
Understanding The Three Pillars Of Telemetry
To get the most out of Azure Application Insights, you need to know about its three core data types, often called the three pillars of telemetry. These pillars are logs, metrics, and traces.
Think of them as a doctor’s complete diagnostic toolkit. Together, they give you a full picture of your application's health and performance, showing you not just what happened, but why and who it affected.
By collecting this telemetry, Application Insights turns a flood of raw data into clear, actionable insights about your system's health and how users are interacting with it. Let's break down each of these telemetry types.
Logs: A Detailed Diary of Events
Imagine logs as your application’s detailed diary. Every time something important happens, a user logs in, a database query fails, a specific function runs, the app writes a timestamped entry describing the event.
These entries are packed with context, making them perfect for digging into problems after the fact. When an error pops up, you can comb through the logs from that exact moment to see the sequence of events that led to the failure. In Application Insights, these are often captured as exceptions or custom events.
Metrics: Your Application's Vital Signs
If logs are the diary, then metrics are the vital signs. They are simple numerical measurements taken at regular intervals, like CPU usage, request rate, or average response time.
Unlike logs, which are detailed and text-heavy, metrics are lightweight numbers designed for quick aggregation and charting. They help you answer critical questions at a glance:
- What was our average server response time in the last hour?
- How many user requests per second are we handling right now?
- Is our app’s memory usage creeping up over time?
These continuous measurements are the backbone of performance dashboards and alerting. They tell you when things are going wrong before your users do.
By combining logs, metrics, and traces, Application Insights provides a multi-dimensional view of your application. You can see not only that an error occurred (from a metric spike), but also why it happened (from the log details) and who it impacted (from the trace).
Traces: A User's Journey Map
Traces are like a GPS map for a single request as it winds its way through your application and all its connected services. In a modern microservices setup, a simple user action like clicking "Buy Now" can trigger a chain reaction across half a dozen different components.
A distributed trace follows that entire journey from start to finish, showing you precisely how much time was spent in each service. This makes finding bottlenecks incredibly simple. If a request is slow, a trace will immediately point to the specific service that’s causing the delay.
The Application Map in Application Insights is a powerful visualization built on this trace data, giving you a clear diagram of all your system's dependencies and their performance. It’s what turns abstract data into real intelligence for troubleshooting even the most complex distributed systems.
Key Features for Proactive Application Management
Going beyond just collecting data, Application Insights gives your team a set of powerful features that shift you from fighting fires to preventing them in the first place. These tools help you spot problems as they're developing, often long before a single user is affected.
This proactive stance completely changes how a DevOps team works. It means less stress, less downtime, and more engineering time spent building features instead of patching emergencies.
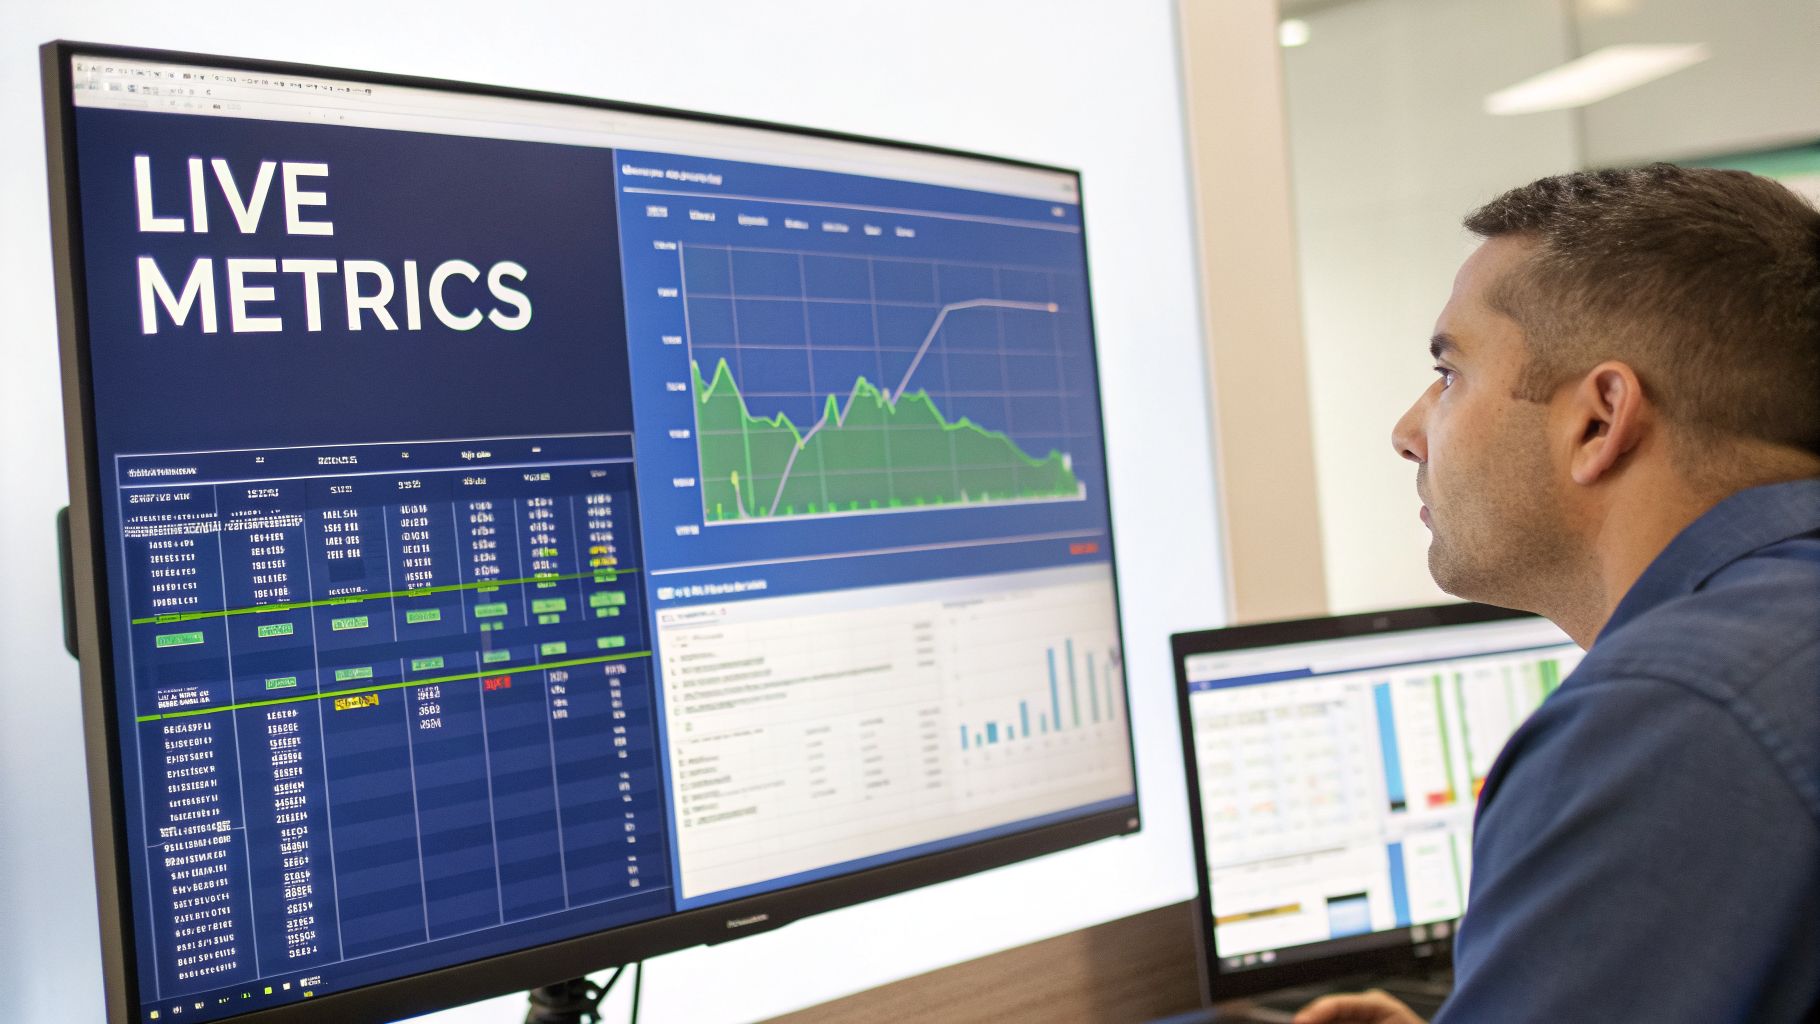
Watch Your App’s Pulse With Live Metrics
Imagine you just pushed a critical update. Instead of nervously waiting for angry emails or error tickets to roll in, you can pull up Live Metrics. It gives you a real-time, one-second-latency view of your application’s vital signs. Think of it as an EKG for your app, showing live requests, performance stats, and failures the moment they happen.
This feature is a lifesaver during high-stakes events like a major deployment or a big marketing push. You can instantly see if the new code is struggling or if performance is degrading under load, letting you react immediately.
Find Problems Before They Escalate With Smart Detection
What if your application could warn you that it was about to have a problem? That's exactly what Smart Detection does. It uses machine learning to constantly analyze the stream of telemetry data your app sends.
Smart Detection acts as an automated watchdog, proactively analyzing performance patterns and failure rates. It automatically flags unusual changes, such as a sudden spike in failed requests or a slowdown in server response times, turning raw data into an early warning system.
This helps you catch those brewing issues that would otherwise go completely unnoticed until they cause a major outage. It’s a foundational piece for any proactive monitoring strategy and a key part of following modern incident management best practices.
Guarantee Uptime With Availability Tests
You need absolute certainty that your application is up and running for users around the world. Availability Tests let you set up automated "ping tests" from different Azure data centers to check your app’s health and responsiveness from multiple global locations.
These aren't just simple pings, either. You can configure multi-step web tests that do much more. For example, a single test could:
- Ping your homepage to make sure it's online.
- Check for a specific HTTP status code, like a 200 OK.
- Verify your SSL certificate is valid and not about to expire.
The numbers really highlight the impact of these features. As of 2026, Application Insights is part of over 60% of Azure App Service deployments. Web apps using it have seen 35% fewer outages, and Smart Detection has preemptively alerted teams to 80% of developing anomalies. This points to a clear trend: more resilient and reliable applications. You can also dive deeper by reading our guide to monitoring in the cloud for peak performance.
Your Guide To Instrumentation And Setup
So, how do you get your app talking to Application Insights? The process is called instrumentation, and it's much simpler than you might think. It’s all about connecting your application to the service so it can start sending telemetry data. For many setups, this is a zero-code or low-code task that can have you seeing valuable data on your dashboard in minutes.
Your first move is always to create an Application Insights resource right in the Azure portal. Think of this resource as the central hub where all your application's telemetry is collected, analyzed, and visualized. Once you create it, Azure will give you a unique connection string. This is the critical key that links your application code to this specific resource.
Choosing Your Instrumentation Method
After creating the resource, you have two main paths to choose from: a codeless approach or a manual one using an SDK. The best option really depends on where your application is hosted and how much granular control you need.
Codeless Auto-Instrumentation: This is by far the easiest way to get started. If you're using services like Azure App Services, Azure Functions, or Virtual Machine Scale Sets, you can enable Application Insights with just a few clicks in the Azure portal. It works by automatically injecting the necessary monitoring agents, and you don't have to touch a single line of your application's code.
Manual SDK Instrumentation: For more control or for apps running outside of Azure, you can add the Application Insights SDK directly to your project. This means adding a small code package and initializing it with your connection string. The big advantage here is that you can add custom telemetry, like tracking specific business events or enriching the data with user-specific properties.
The modern approach, even for a manual setup, is to use the Azure Monitor OpenTelemetry Distro. This is Microsoft's recommended path forward because it blends the power of Application Insights with the vendor-neutral standards of OpenTelemetry, giving you much more flexibility down the road.
Setup For Common Platforms
The setup process is well-documented and pretty streamlined for today's most popular development platforms. For a .NET application, for example, you’ll typically just install a NuGet package and add a single line of code to your startup configuration.
For Java applications, it can be even simpler. You can often just attach the Java agent at runtime without any code changes at all. This agent is smart enough to automatically detect common frameworks like Spring and start logging requests, dependencies, and exceptions. Similarly, Node.js applications can be instrumented by importing and initializing the SDK at the very beginning of your main application file.
Once connected, your application's data will start flowing into its associated Log Analytics Workspace, ready for you to analyze.
Optimizing Performance And Costs
This is where the rubber meets the road. Connecting your application monitoring directly to the bottom line is what makes Application Insights so valuable. It’s not just about squashing bugs; it’s about actively cutting operational spend by rooting out waste. You get a powerful feedback loop where better performance directly leads to real cost savings.
A key tool for this is the Profiler. You can think of it like a detective for your code, investigating how it behaves in a live production environment. It finds those sneaky "hot paths", code that hogs way too much CPU and memory, all without getting in your users' way.
Diving Deep With Custom Queries
To get to the really good stuff, you need to speak your data's language. In Application Insights, that language is the Kusto Query Language (KQL). KQL is your key to unlocking the raw telemetry data sitting in Log Analytics.
With KQL, you're no longer limited to the out-of-the-box dashboards. You can start asking specific, tough questions that are tailored to your business, like:
- Which API endpoint performs the worst for our customers in Europe?
- What’s the failure rate of our payment gateway dependency during our busiest hours?
- How many unique users were hit by that specific error yesterday?
Answering questions like these lets you build custom dashboards that focus on the metrics that actually matter to your business. This level of monitoring is non-negotiable in complex enterprise web software development, where every bit of performance and efficiency counts.
By focusing on performance metrics, Application Insights has driven a 45% average reduction in application latency for Azure users since its AI enhancements in 2024. The tool's Profiler identified bottlenecks consuming 50% of CPU in real world .NET apps. These insights provide the perfect data for platforms that can act on them. Find out more about these performance and cost findings on hginsights.com.
From Performance Insights To Real Savings
This is where performance tuning and cost control really click together. Application Insights is brilliant at flagging inefficiencies, like over-provisioned servers or resource-hungry code. But identifying the problem is only half the battle, acting on it is what saves you money.
This is where a dedicated cost optimization platform becomes a game-changer. For example, Application Insights might show you that a whole group of dev servers are sitting idle for 12 hours every single night. A tool like CLOUD TOGGLE can take that specific insight and turn it into automatic savings.
By setting up a simple schedule, CLOUD TOGGLE can automatically shut down those idle resources, turning that performance data into direct cloud cost savings. This closes the loop, creating a full cycle of detection, analysis, and optimization. If you're looking to trim your cloud bill, check out our complete guide on Azure cost optimization.
Common Questions About Application Insights
When you’re first digging into Application Insights, a few practical questions always seem to pop up. How much does it cost? How does it fit in with other Azure services?
Let's get these questions answered so you can confidently start monitoring your apps.
How Is Pricing For Application Insights Calculated?
The pricing model is refreshingly simple. You're billed for two main things: the volume of telemetry data you send (ingestion) and how long you decide to keep it (retention). It’s a pay-as-you-go system, charging you per gigabyte (GB) of data that comes in.
This gives you a surprising amount of control over your bill. To keep costs in check, you have a few powerful levers to pull:
- Sampling: This is a smart way to reduce data volume without losing visibility. Instead of sending every single event, Application Insights sends a representative sample, which can slash your ingestion costs while keeping your metrics accurate.
- Daily Caps: You can set a hard daily limit on data ingestion. Think of it as a safety net. If a bug in your app suddenly starts spewing millions of errors, this cap prevents a massive, unexpected bill.
- Adjustable Retention: You get to choose how long your telemetry data sticks around, from 30 days all the way up to 730 days. Shorter retention periods mean lower storage costs, simple as that.
For many small and midsize apps, the free daily data allowance is often more than enough to cover essential monitoring. This makes it incredibly easy to get started and see the value right away, often without spending a dime.
What Is The Difference Between Application Insights And Azure Monitor?
The best way to think about it is like a mechanic’s toolbox. Azure Monitor is the entire toolbox, responsible for watching over everything in your Azure environment. Application Insights is the specialized diagnostic scanner you plug in to figure out exactly what’s wrong with the engine.
Azure Monitor keeps a broad eye on your infrastructure, things like virtual machines, networks, and storage. It answers questions like, "Is my server's CPU pegged at 100%?" or "Is our network connection lagging?"
Application Insights, on the other hand, lives inside your application's code. It's built to answer questions like, "Why is this specific API call taking three seconds to complete?" or "What line of code is causing this null reference exception?"
Crucially, these tools are built to work together. All the data from both Application Insights and Azure Monitor funnels into the same backend data platform, a Log Analytics Workspace. This is a game-changer, as it lets you easily connect an application error found in Application Insights to a CPU spike flagged by Azure Monitor, all in one place.
Can I Use Application Insights For Apps Not Hosted On Azure?
Yes, absolutely. While it’s a first-class citizen in the Azure world, Application Insights is fundamentally platform-agnostic. You can use it to monitor applications running just about anywhere.
This includes apps running:
- On-premises in your own data center
- In other public clouds like Amazon Web Services (AWS) or Google Cloud Platform (GCP)
- In hybrid cloud setups
The magic is in the Application Insights SDK (Software Development Kit). You just install the right SDK for your app’s language, like .NET, Java, Python, or Node.js, and configure it to send telemetry back to your resource in Azure. This flexibility makes it a fantastic central APM for your entire software portfolio, no matter where it's hosted.
How Does Application Insights Help With Cost Optimization?
Application Insights is a fantastic tool for finding ways to save money, both by boosting performance and by showing you how your app is actually being used. It gives you the hard data you need to make smarter, more cost-effective architectural decisions.
First, it sniffs out performance bottlenecks. Tools like the Profiler can point directly to inefficient code that’s hogging CPU and memory. When you fix these "hot paths," your app can handle the same workload with fewer resources. That means you can run on smaller, cheaper VMs or use fewer instances in an auto-scaling group.
Second, it shines a light on your application’s real-world usage patterns. By analyzing traffic over time, you can see exactly when your app is busy and when it's sitting idle. This data is pure gold for making intelligent scaling decisions, and it works perfectly with a cost optimization platform that can act on these insights.
This is precisely where a tool like CLOUD TOGGLE fits in. After Application Insights shows you that your dev and staging servers are idle every night and on weekends, CLOUD TOGGLE can automatically shut them down based on a simple schedule. This simple action turns performance data into direct, predictable savings on your cloud bill. Find out how you can start reducing your cloud spend today at https://cloudtoggle.com.