Monitoring your cloud services is all about keeping a close eye on the health, performance, and availability of your entire cloud setup. Think of it as the instrument panel for your digital operation. It gives you the real-time data you need to stop problems before they start, keep costs in check, and make sure your users have a great experience. Without it, you’re flying blind in a very complex and expensive environment.
Why Monitoring Your Cloud Services Is Non-Negotiable
Moving to the cloud isn't a "set it and forget it" project. Imagine trying to drive a high-performance car with no dashboard. You’d have no idea how fast you were going, how much fuel you had left, or if the engine was about to overheat. A breakdown wouldn't be a matter of if, but when.
That’s exactly what’s happening when businesses run their cloud infrastructure without proper oversight.
Good monitoring turns that mysterious black box into a transparent, manageable asset. It delivers the critical visibility you need to get a handle on performance, security, and one of the biggest headaches for modern businesses: cost.
The Soaring Costs of Flying Blind
The explosion in cloud adoption has created an environment where costs can easily spiral out of control. The global cloud computing market is on track to nearly double, reaching a staggering $1.614 trillion by 2030. That kind of growth demands vigilant cost control.
It's no surprise that 33% of organizations are now spending over $12 million a year on the public cloud, while 82% of cloud decision-makers say managing that spend is their number one challenge. You can dig into more numbers in this complete report on cloud computing statistics.
Without a clear view of how resources are being used, companies are unknowingly paying for idle servers, oversized databases, and forgotten storage. These hidden costs add up fast, eating away at profit margins and completely undermining the financial perks of moving to the cloud in the first place.
Monitoring isn’t just a technical task; it's a fundamental business practice. It turns raw data into actionable intelligence, empowering teams to make smart decisions that directly impact performance, reliability, and the bottom line.
This intelligence is vital for everyone, from IT managers and DevOps teams to the FinOps pros watching the budget. Each group relies on this data to get answers to mission-critical questions about their digital infrastructure.
Answering Critical Business Questions
A solid monitoring strategy delivers clear answers to the questions that keep different teams up at night, ensuring everyone is on the same page. It helps them understand what’s really happening inside their cloud environment.
- For DevOps Teams: "Is our application responding quickly enough for our users, or are there performance bottlenecks we need to squash?"
- For IT Managers: "Are our systems secure, and can we handle a sudden traffic spike without everything crashing down?"
- For FinOps Professionals: "Are we wasting money on idle resources, and where are our biggest opportunities to cut costs?"
By creating a single source of truth, monitoring bridges the gap between technical operations and business goals. It makes sure that technical decisions are directly tied to financial outcomes, helping your organization thrive.
Understanding Your Cloud Environment's Vital Signs
Good cloud monitoring is all about turning a chaotic stream of raw data into a clear story about your system’s health. It means collecting and making sense of different signals, or telemetry, that act like your environment's vital signs. Without them, you're just guessing about performance, stability, and critically, your monthly bill.
These signals really fall into three essential buckets. Each one gives you a different piece of the puzzle, and only when you put them together do you get the full picture of your cloud operations. This is how you go from just collecting data to making smart, proactive decisions.
Infrastructure Health Metrics
First things first, you have to monitor the health of your core infrastructure. Think of this like checking the engine, tires, and oil in your car before a long road trip. These metrics tell you if the basic components are working correctly and have enough gas in the tank to handle the journey ahead.
Here are the key infrastructure metrics to watch:
- CPU Utilization: This tells you how hard your servers are working. If your CPU usage is constantly maxed out, it’s a red flag that your instances might be too small or your code is struggling.
- Memory Usage: This tracks how much RAM is being used up. If you run out of memory, applications slow to a crawl or crash entirely, making it a critical stability metric.
- Disk I/O (Input/Output): This measures how fast data is being read from and written to your storage. Slow disk I/O can be a major bottleneck, especially for applications that rely heavily on a database.
- Network Throughput: This shows how much data is flowing in and out of your systems. Weird spikes or sudden drops can point to performance problems or even potential security threats.
Keeping an eye on these foundational signals is the first step in any solid strategy for monitoring cloud services. It helps you spot resource shortages before they cause a full-blown outage, keeping your platform stable and responsive.
Application Performance Metrics
While your infrastructure might be humming along perfectly, it doesn't mean your users are having a good time. That’s where Application Performance Monitoring (APM) comes in. APM focuses directly on how your software is behaving from the user's perspective.
APM data is where technical performance meets real business impact. A high error rate isn't just a technical problem; it's a line of frustrated customers who might be about to click over to a competitor.
These metrics reveal how your services are performing in the real world:
- Response Time (Latency): This is the time it takes for your application to answer a user's request. Slow response times are one of the fastest ways to lose a customer.
- Error Rate: This tracks the percentage of requests that end in an error. A rising error rate is a clear signal that something is broken and needs fixing fast.
- Transaction Throughput: This measures how many requests or transactions your application can handle per minute. It helps you understand your capacity and plan for scaling up during busy periods.
By watching these application signals, you can hunt down inefficient code, find bugs, and make sure your customers get a smooth, reliable experience.
Cloud Cost Metrics
The final piece of the monitoring puzzle is cost. In the cloud, every single resource has a price tag, and without tight controls, your bill can balloon surprisingly quickly. Monitoring cost metrics gives you the financial visibility you need to run a sustainable and profitable operation.
These are the most important cost signals to track:
- Spend Per Service: You need to know exactly how much you're spending on each cloud service (like EC2, S3, or RDS) to find your biggest cost drivers.
- Idle Resource Hours: This is one of the biggest sources of wasted money in the cloud. Tracking servers, databases, and other resources that are running but not actually doing anything shows you exactly where you can start saving money today.
- Budget Alerts: Setting up alerts to ping you when your spending gets close to your budget is a simple but powerful way to prevent nasty surprises at the end of the month.
When you bring these three types of telemetry, infrastructure, application, and cost, together, you get a complete, 360-degree view of your environment. This is the key to successfully balancing performance, reliability, and financial efficiency in the cloud.
Choosing Your Cloud Monitoring Architecture
Once you know the vital signs of your cloud environment, the next big question is: how are you going to collect and analyze all that data? Choosing the right monitoring architecture isn't just a technical detail, it directly impacts your team's efficiency, response times, and ultimately, your budget.
You've really got two main paths to choose from. You can start with the native tools your cloud provider offers, or you can bring in specialized third-party platforms for a more centralized approach. Each strategy has its own pros and cons, and the right choice depends on your organization's needs and scale.
Starting with Native Cloud Provider Tools
The most direct way to get started is by using the tools built right into your cloud platform. Think of services like Amazon CloudWatch for AWS, Azure Monitor for Microsoft Azure, or Google Cloud's Operations Suite. These tools are like the basic security system that comes with a new house: they’re already integrated, easy to set up, and cover the essentials right out of the box.
For small teams or businesses operating entirely on a single cloud, this is often the perfect place to start. The benefits are pretty clear:
- Deep Integration: Native tools are built by the provider, for the provider. They have unmatched access to metrics and logs from every single service in that ecosystem.
- Simple Setup: There are no agents to install or complex configurations to wrestle with. Monitoring is often on by default or just a few clicks away in the cloud console.
- Cost-Effective: For basic monitoring, these tools are usually affordable or even part of the free tier, which is great for organizations with tight budgets.
But that simplicity comes with a catch. Native tools are designed to work best inside their own walled gardens. If your company uses more than one cloud, you’ll end up juggling different dashboards and struggling to get a single, unified view of your entire infrastructure.
Adopting a Unified Third-Party Architecture
As organizations grow, they often end up with a multi-cloud or hybrid strategy. This is where a more advanced architecture using third-party monitoring tools becomes a necessity. Think of it as upgrading your home's basic alarm to a comprehensive, integrated security system with one command center for everything.
These platforms provide a "single pane of glass" view across all your environments, whether they're on AWS, Azure, Google Cloud, or even on-premises. This unified approach is critical as your cloud footprint gets more complex.
This is more important than ever. In a recent quarter, the global cloud infrastructure market soared to $107 billion, a massive 28% jump from the previous year. With giants like AWS and Microsoft Azure leading the pack, many businesses find themselves managing resources across both platforms, especially to power new AI workloads. A centralized monitoring tool is essential to track usage spikes and stop idle resources from quietly draining your budget.
When you're designing this architecture, you also need a plan for storing and managing the massive amounts of performance data you'll collect. Knowing the difference between a data warehouse vs data lake can help you make smarter choices here.
For a deeper dive into managing your entire cloud ecosystem, check out our guide on selecting a https://www.cloudtoggle.com/blog-en/cloud-management-platform/.
Comparing Monitoring Architectures Native vs Third-Party Tools
Deciding between native tools, third-party platforms, or a specialized cost optimization tool can be tough. Each offers a different set of capabilities geared toward specific goals, from basic performance tracking to aggressive cost control. The table below breaks down the key differences to help you see which approach best fits your needs.
| Feature | Native Cloud Tools (e.g., CloudWatch, Azure Monitor) | Third-Party Platforms (e.g., Datadog, New Relic) | Cost Optimization Tools (e.g., CLOUD TOGGLE) |
|---|---|---|---|
| Primary Focus | Foundational infrastructure and service-level monitoring within a single cloud. | Comprehensive, end-to-end observability (metrics, logs, traces) across multi-cloud. | Direct cost reduction through resource scheduling, rightsizing, and waste identification. |
| Setup & Integration | Seamless and often enabled by default. Deep integration with provider services. | Requires agent installation and configuration but offers broad integrations. | Fast, SaaS-based setup focused on connecting to cloud accounts for immediate savings. |
| Multi-Cloud Support | Limited or non-existent. Each provider's tool is siloed. | Excellent. Designed from the ground up to unify data from all environments. | Strong. Often supports major providers like AWS, Azure, and GCP from a single interface. |
| User Experience | Functional but can be complex and tied to the provider's console UI. | Highly polished dashboards, custom visualizations, and user-friendly workflows. | Extremely simple and intuitive, designed for both technical and non-technical users. |
| Cost Management | Provides basic billing data and cost alerts. Not focused on proactive optimization. | Can correlate performance with cost but is primarily an observability tool. | Core mission is to automate cost savings with features like scheduling and idle detection. |
| Best For | Small teams, single-cloud environments, and basic health monitoring. | Mature organizations with complex, multi-cloud setups needing deep observability. | Businesses of any size looking for the fastest and easiest way to cut cloud waste and reduce spend. |
Ultimately, the best choice depends on your priorities. If you just need basic health checks in one cloud, native tools are a great start. If you need deep, unified visibility across a complex environment, a third-party platform is the way to go. But if your main goal is to actively cut costs with minimal effort, a specialized tool like CLOUD TOGGLE offers the most direct path to savings.
Implementing a Proactive Monitoring Strategy
The biggest leap you can make in managing your cloud environment is moving from a reactive to a proactive mindset. Instead of waiting for something to break and then scrambling to fix it, a proactive strategy helps you spot and solve issues long before they ever impact your users or your bottom line. This isn't just about installing new tools; it's about building a clear plan based on what you want to achieve.
Simply collecting data isn't a strategy. Before you even think about monitoring a single metric, you have to define what success actually looks like for your team. Are you trying to slash application response times, rein in infrastructure costs, or guarantee a certain level of uptime? Setting clear, measurable goals from day one ensures your monitoring efforts are laser-focused on what really matters to the business.
Without clear objectives, you'll quickly find yourself drowning in a sea of irrelevant data and alerts. It's a classic mistake that leads to confusion and, ultimately, inaction.
Setting Intelligent Alerting Thresholds
One of the fastest ways to kill a new monitoring strategy is with alert fatigue. If your team gets bombarded with constant, low-priority pings, they’ll inevitably start tuning them out, including the critical ones. The trick is to move beyond simple, static rules like "alert when CPU hits 80%" and adopt smarter, context-aware alerting.
This means creating rules that understand your normal operational rhythm. For instance, instead of a fixed CPU threshold, you could set an alert that only fires if CPU usage stays above 80% for more than ten minutes. This one small change filters out harmless, temporary spikes and makes sure your team only jumps on sustained, genuine problems.
A well-tuned alerting system acts as a precise signal, not just noise. It should empower your team to act decisively on real issues rather than forcing them to sift through a constant stream of false alarms.
Your goal is to make every alert meaningful. This involves setting up different severity levels for different problems. A critical database failure should trigger an immediate page to an on-call engineer, while a minor performance dip might just create a ticket in your project management tool to be looked at during business hours.
Creating Stakeholder-Specific Dashboards
Different people across your company need different information from your monitoring system. An engineer trying to fix a performance bug needs granular, real-time data. An executive, on the other hand, just wants a high-level overview of service health and cost trends. Creating custom dashboards for each stakeholder is the key to making your monitoring data useful for everyone.
- For Engineers: These dashboards should be packed with the nitty-gritty details like CPU utilization, memory usage, latency, and error rates. These are the deep-dive views needed for diagnostics and finding the root cause of an issue.
- For Managers: A manager's dashboard should zoom out a bit to focus on service-level objectives (SLOs), uptime percentages, and how their team's resources are being used. This view helps them track performance against business goals.
- For Executives: Executive dashboards need to be simple and at-a-glance. They should summarize overall system health and, most importantly, cost efficiency. Charts showing month-over-month cloud spend and savings from optimization efforts are perfect here.
Integrating Monitoring with Cost Optimization
Finally, a truly proactive strategy must treat cost as a first-class metric, right alongside performance and uptime. Monitoring for idle resources isn't just a technical task anymore; it's a financial necessity, especially as cloud adoption continues to explode.
Recent data shows that cloud infrastructure spending skyrocketed 21% year-over-year to $90.9 billion in a single quarter, fueled by AI and large-scale migrations. For any business running in the cloud, this growth brings significant financial risk. In fact, some surveys show that a staggering 82% of companies struggle to control their cloud spend. Unchecked environments can easily lead to a 20-30% overspend on idle compute costs alone, making automated oversight a must-have for financial stability. You can dive deeper into these figures by checking out the latest global cloud spending trends.
By building a proactive monitoring strategy that combines clear goals, smart alerting, tailored dashboards, and a relentless focus on cost, you can transform your cloud operations from a source of stress into a powerful engine for business growth.
Turning Monitoring Data into Actionable Cost Savings
Good cloud monitoring does more than just keep the lights on. It's one of the most direct ways to turn visibility into real financial savings. When you start tracking specific cost signals, like server idle time, you can build powerful workflows that connect technical data directly to your bottom line. This is where the abstract idea of "observability" gets down to business.
Picture a common scene for any busy DevOps team. The monitoring dashboard clearly shows that development and staging servers are spinning away 24/7. But they're effectively idle for more than 12 hours every single day, not to mention all weekend. Without the right tools, this is just an interesting data point. With them, it's a massive cost-saving opportunity staring you in the face.
Instead of just shrugging at the waste, the team can take direct action. They can move beyond simple observation and put a system in place to reclaim that wasted spend. This is the crucial leap where monitoring evolves into optimization.
From Insights to Automation
The only practical way to act on this kind of insight is through automation. Nobody wants to manually shut down and restart servers every day. It's tedious, prone to human error, and simply doesn't scale as you grow. This is exactly where specialized platforms come in, turning those monitoring data points into automated, money-saving actions.
A tool like CLOUD TOGGLE is built for this exact workflow. It lets the team create a simple, automated power-off schedule for all their non-production instances.
- Set It and Forget It: You can configure schedules for servers to automatically shut down during off-hours, like evenings and weekends, and stop paying for idle time.
- Empower the Team Safely: Use role-based access controls to let developers or project managers handle their own schedules without giving them the keys to the entire cloud account.
- Stay Flexible: Need to work late or handle a weekend deployment? You can instantly override a schedule, ensuring optimization never gets in the way of getting work done.
This automated approach bridges the gap between DevOps and FinOps, creating a system where technical efficiency and financial responsibility work together. The process is straightforward, following a simple three-step cycle of proactive monitoring.
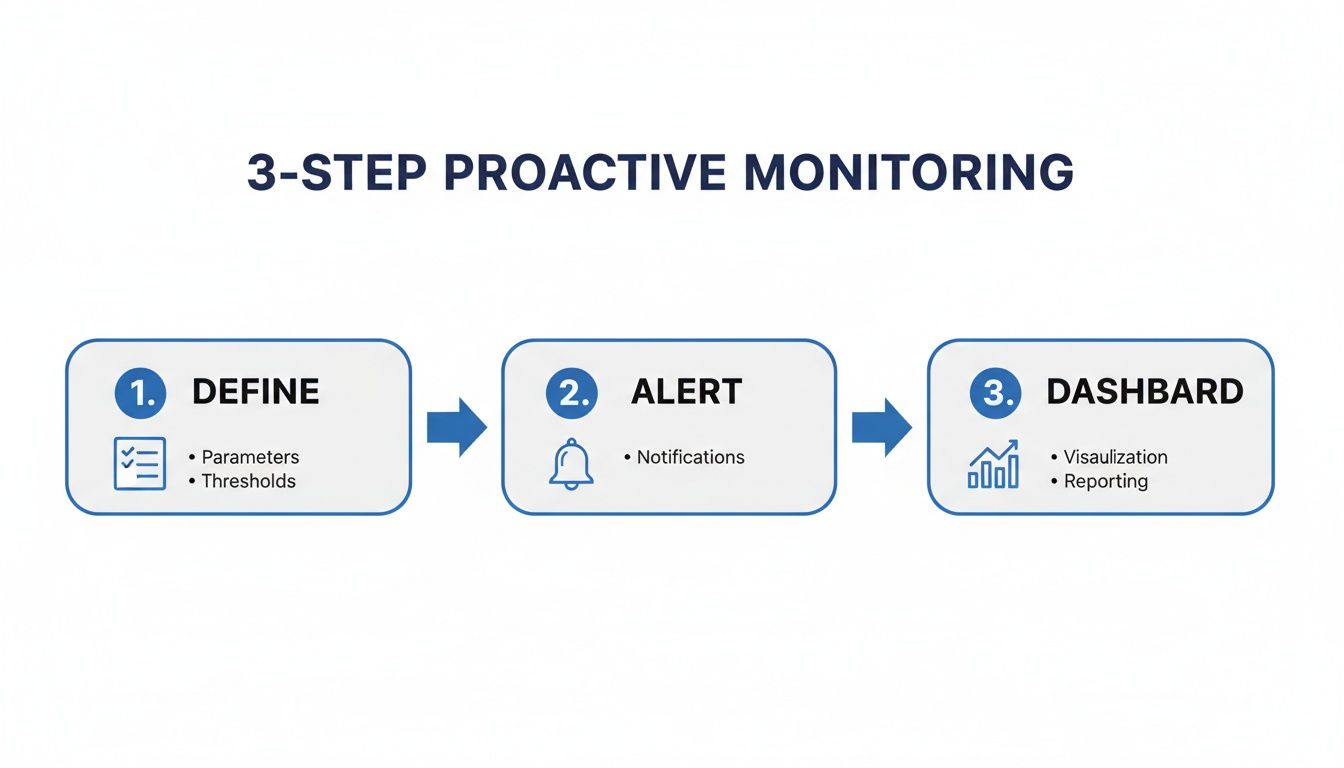
This flow shows how defining clear metrics, setting smart alerts, and using a unified dashboard creates a virtuous cycle of continuous improvement and savings.
Making Cost Optimization Accessible
One of the biggest hurdles to saving money in the cloud is complexity. Let's be honest, native cloud provider consoles are powerful but can be completely overwhelming for non-engineers. This often turns cost management into a bottleneck, where everything depends on a small group of cloud experts.
Platforms designed for simplicity flip this dynamic on its head. An intuitive interface means it’s not just the DevOps team who can help save money. A project manager can safely adjust the schedule for their team's test environment, or someone from finance can view savings reports without needing to know what a VPC is.
By making cost-saving tools accessible to a wider audience, you create a culture of financial accountability. Everyone is empowered to do their part in reducing waste, turning cost optimization into a shared responsibility rather than a siloed task.
This approach is not only more efficient but also far more scalable. As your organization grows, you can easily apply these automated scheduling policies across new projects and teams, keeping your cloud spend lean and predictable. For more strategies on this topic, check out our guide to https://www.cloudtoggle.com/blog-en/cloud-cost-optimisation/.
This shift toward automated, user-friendly cost control is proving effective across many industries. To see just how effective this can be, take a look at these real-world examples of reducing costs with AI and automation. Ultimately, the goal isn't just to see what’s happening in your cloud environment. It's to use that knowledge to build a more efficient, resilient, and financially sound operation. When you connect data directly to action, your monitoring platform becomes one of your most valuable cost-saving assets.
Common Questions About Cloud Monitoring
As teams get their feet wet with cloud monitoring, a few questions always seem to surface. Getting straight answers can help you cut through the noise, build a smart strategy, and start turning all that data into real-world action.
Let's tackle some of the most common hurdles and misconceptions head-on. Whether you're wondering where to start, how to stop drowning in alerts, or which tools to pick, these answers will help you get your monitoring program on the right track from day one.
What Is the First Thing I Should Monitor in My Cloud Environment?
It's easy to get buried in data when you first start. The trick is to ignore most of it and focus on what gives you the most immediate bang for your buck. Think about the "big three" pillars that directly hit your business operations and your wallet.
Get started by covering these fundamentals:
- Performance: The absolute essentials are your basic infrastructure signals, things like CPU utilization, memory usage, and network traffic. These metrics tell you if your core systems are healthy or gasping for air.
- Cost: Right away, start tracking your total spend for each service. Even more important, pinpoint your top-spending resources. This is almost always where you'll find the fastest and easiest cost savings.
- Security: To get a basic security baseline, begin by monitoring access logs and user permissions. This gives you a clear picture of who is doing what and helps you spot weird or unauthorized activity before it becomes a real problem.
This first layer gives you a solid foundation. You'll have actionable information on the health, cost, and security of your environment, letting you fix the most urgent problems first and build out your strategy from there.
How Do I Avoid Getting Overwhelmed with Alerts?
Alert fatigue is a real killer for any monitoring strategy. If your team is constantly peppered with low-priority notifications, they'll quickly start ignoring all of them, including the critical ones. The solution is to create smarter, context-aware alerts instead of just setting simple, static tripwires.
The point of an alert isn't just to say a metric crossed a line. It's to signal a genuine, business-impacting problem that needs a human to look at it. Good alerting is about signal, not noise.
To keep your team from drowning, try these practices:
- Use Anomaly Detection: Instead of a fixed rule like "alert when CPU hits 80%," use tools that learn your system's normal rhythm. Anomaly detection only flags genuinely unusual behavior, filtering out predictable daily spikes.
- Group Related Alerts: Bundle notifications from connected systems into a single, cohesive incident. If a network failure knocks out ten services, your team needs one alert explaining the root cause, not ten separate alarms causing chaos.
- Create Tiered Alerting Systems: Not every problem is a five-alarm fire. Set up severity levels where only the most critical issues trigger a page or a late-night call to an engineer. This keeps their attention focused on what actually matters.
Can I Use Both Native Cloud Tools and Third Party Platforms?
Yes, and you absolutely should. Mixing native cloud tools with third-party platforms is not only common but also one of the most effective strategies out there. This hybrid approach lets you play to the strengths of each, creating a best-of-both-worlds monitoring stack.
Most teams start with native tools like AWS CloudWatch or Azure Monitor because they're already baked in and are great for collecting raw infrastructure logs and metrics right from the source.
From there, they often forward that raw data to a more specialized third-party platform. These tools are built for advanced visualization, correlating data across different clouds, and offering sophisticated Application Performance Monitoring (APM). This layered approach gives you the tight integration of native tools with the unified, user-friendly power of a dedicated platform, delivering a complete picture of your entire environment.
Ready to turn your monitoring insights into significant cost savings? With CLOUD TOGGLE, you can automate the process of shutting down idle cloud resources, cutting waste without manual effort. Our intuitive platform makes it easy for anyone on your team to set schedules, manage servers, and see the financial impact. Start your 30-day free trial today and see how much you can save.