Trying to run a cloud environment without a clear view of what’s happening is like flying blind. You might be fine for a while, but you’re heading for trouble. Cloud monitoring is your instrument panel, the collection of practices and tools you use to keep an eye on the health of your applications and infrastructure on platforms like AWS or Azure.
It’s about much more than just waiting for an error message to pop up. Think of it as a proactive strategy to guarantee uptime, squeeze every last drop of performance out of your setup, and keep your cloud bills from spiraling out of control.
Why You Can’t Afford to Ignore Cloud Monitoring
The beauty of the cloud is its flexibility. You can spin up resources in minutes and scale them down just as fast. But this power comes with a price: complexity. Your applications are likely spread across dozens of services, creating a tangled web of dependencies.
Without a solid monitoring strategy, your team is stuck in a reactive loop, scrambling to fix problems only after they’ve already annoyed your users. Good monitoring flips that script. It turns firefighting into fire prevention, giving you the data you need to understand how your system behaves, spot trouble before it starts, and make smart, informed decisions.
The market gets it. Currently valued at around USD 3 billion, the cloud monitoring space is expected to explode to over USD 14 billion by 2033. This isn't just hype; it's a direct response to businesses adopting multi-cloud and hybrid setups and realizing they need a single, unified view to manage it all. You can discover more insights about this expanding market and what it signals for the industry.
The Four Pillars of Cloud Monitoring
A truly effective monitoring strategy isn't a random collection of metrics; it’s built on four foundational goals. Each one is critical to making sure your technology is actually serving your business, not holding it back.
A solid monitoring plan is about more than just collecting data; it's about achieving specific business outcomes. The table below breaks down the four core pillars that transform monitoring from a technical chore into a strategic advantage.
| Pillar | Objective | Business Impact |
|---|---|---|
| Availability | Keep services online and accessible 24/7. | Prevents lost revenue, protects brand reputation, and ensures customer trust. |
| Performance | Ensure applications are fast and responsive. | Improves user experience, boosts engagement, and drives conversions. |
| Security | Detect and respond to threats in real-time. | Protects sensitive data, prevents breaches, and maintains compliance. |
| Cost Management | Optimize resource usage and eliminate waste. | Reduces operational expenses, improves budget predictability, and increases ROI. |
Nailing these four pillars is what separates the pros from the amateurs. It turns monitoring into the bedrock of a successful digital operation.
When you master these four pillars, monitoring stops being a simple tech task and becomes a core part of your business strategy. It gives your DevOps and Site Reliability Engineering (SRE) teams the power to not just maintain the status quo, but to constantly improve and innovate. In today’s world, that proactive mindset is what it takes to win.
Decoding Your System's Language with Telemetry Data
To really understand what's happening inside your cloud environment, you need to learn to speak its language. That language is made up of telemetry data, all the raw information your systems are constantly generating. Solid cloud monitoring is all about collecting and making sense of these signals to get a clear picture of what’s going on under the hood.
This data is usually broken down into what we call the "three pillars of observability": Logs, Metrics, and Traces. Each one gives you a totally different, but equally critical, view of your system's health.
The Three Pillars of Observability
Think of Metrics as your system’s heartbeat. They are simple, numerical data points tagged with a timestamp, telling you the state of a resource at a specific moment. A metric could be CPU utilization is at 75% or an API response time of 200ms. They're lightweight, easy to store, and perfect for building dashboards or triggering alerts.
Logs, on the other hand, are the detailed diary of your system. They are timestamped text records, sometimes structured, sometimes not, that capture specific events. If a user fails to log in or a database connection times out, a log entry gets created with the nitty-gritty details of what happened, why, and when.
Finally, Traces act like a GPS for your application requests. In a modern microservices setup, a single click from a user can bounce through dozens of different services. A trace follows that request from start to finish, showing you exactly how long it spent in each service. This is invaluable for finding bottlenecks or figuring out where a complex workflow failed.
The infographic below shows how these pillars support the core goals of cloud management, from keeping the lights on to keeping costs down.
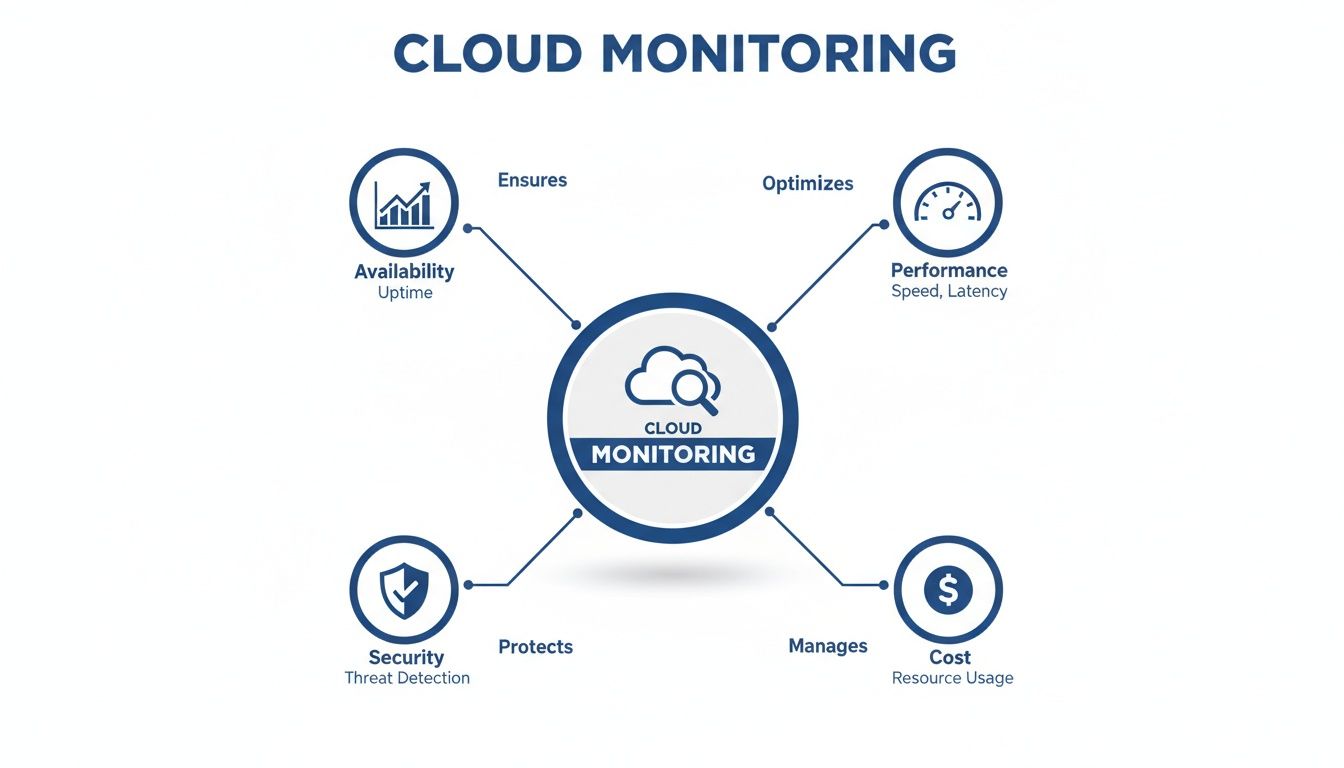
This highlights how availability, performance, security, and cost aren't separate issues; they're all connected. For a deeper look at this, learning about enhancing data observability can give you a real edge, especially when you can integrate data from tools you already use.
Bringing It All Together
Here’s the thing: no single pillar tells you the whole story. Real observability happens when you use all three together to get answers.
An alert fires because a metric like error rate just spiked. You immediately jump to the logs to find the specific error message. From there, you use traces to see which downstream service was the real source of the problem.
This interconnected approach is the backbone of modern monitoring. Frameworks like OpenTelemetry have even emerged to standardize how this data is collected, making it way easier to get a complete picture across all your different tools. The goal is to create one unified stream of data that lets your team go from asking "What broke?" to "Why did it break?" in record time.
Choosing Your Cloud Monitoring Toolkit
Picking the right tools to monitor your cloud setup can feel overwhelming. The market is flooded with options, and every single one promises the perfect window into your systems. At the end of the day, your decision boils down to one key choice: do you stick with the tools your cloud provider gives you, or do you bring in a specialized third-party platform?
Each path has its own clear benefits. Native tools, like AWS CloudWatch or Azure Monitor, offer a smooth, out-of-the-box experience. Since they’re built by the same company running your infrastructure, setup is usually a breeze, and they automatically start collecting data from core services. For teams living entirely within one cloud ecosystem, this deep integration is a massive win.
But that tight integration can also become a problem. It can lead to vendor lock-in, making it a real headache to move your workloads or manage resources if you decide to use more than one cloud provider. As more companies spread their infrastructure across AWS, Azure, and Google Cloud, relying on a single vendor's tools can create dangerous blind spots.
Native Tools vs. Third-Party Solutions
This is exactly where third-party platforms like Datadog, New Relic, or Dynatrace come into the picture. Their biggest advantage is that they don’t play favorites; they are vendor-agnostic. They were designed from the ground up to give you a single pane of glass that works across multiple clouds, on-premise data centers, and all sorts of SaaS products.
This unified view is non-negotiable when your services are scattered everywhere. In fact, a recent study found that 76% of organizations are already using two or more cloud providers, which makes a consolidated dashboard more of a necessity than a nice-to-have. These platforms often come with more advanced features, slicker dashboards, and more powerful analytics than their native counterparts.
For example, here’s a look at the AWS CloudWatch dashboard, a very popular native tool.
It gives you a clean, built-in view of key metrics like CPU utilization and network traffic for your AWS resources. This immediate access to core infrastructure health is the main draw of native tools.
The core trade-off is clear: Native tools offer simplicity and deep integration within a single ecosystem. Third-party tools provide flexibility and a unified view for complex, multi-cloud, or hybrid environments.
To make this choice clearer, let's break down the pros and cons side-by-side.
Native vs Third-Party Monitoring Tools
Here’s a comparative overview of the advantages and disadvantages of using cloud provider tools versus specialized third-party solutions.
| Factor | Native Cloud Tools (e.g., CloudWatch) | Third-Party Tools (e.g., Datadog) |
|---|---|---|
| Integration | Seamless, out-of-the-box integration with the provider's ecosystem. | Requires agent installation and configuration but supports a wide range of technologies. |
| Scope | Primarily focused on the provider’s services, with limited visibility outside of it. | Vendor-agnostic, offering a single view across multi-cloud, hybrid, and on-premise environments. |
| Setup Complexity | Generally simpler and quicker to get started for basic monitoring. | Can be more complex to set up initially but offers greater customization and depth. |
| Features | Core monitoring features are solid, but advanced analytics or APM may be lacking or cost extra. | Often provide more advanced features, better UI/UX, and sophisticated analytics out of the box. |
| Cost | Typically follows a pay-as-you-go model. Can be cost-effective for simple use cases. | Subscription-based, which can be more expensive but often provides more value for complex needs. |
| Vendor Lock-In | High risk of lock-in, making multi-cloud strategies difficult to manage. | Low risk of lock-in, providing the flexibility to switch cloud providers or add new ones. |
Ultimately, the right tool depends entirely on your operational reality and future strategy.
The Rise of Open Source Monitoring
There's also a powerful third option: building your own monitoring stack with open-source tools. Technologies like Prometheus for collecting metrics and Grafana for creating stunning dashboards have become the go-to standard for countless engineering teams. This route gives you maximum flexibility and control, all without any licensing fees.
When you build an open-source stack, you can tailor every single aspect of your monitoring to your exact needs. But that freedom comes with a price: complexity. You're on the hook for setting up, maintaining, scaling, and securing your entire monitoring infrastructure, which demands serious engineering time and expertise.
So, how do you choose? It all comes down to your team's context.
- Single-Cloud Simplicity: If you're all-in on one cloud provider, native tools are a great place to start.
- Multi-Cloud Complexity: For businesses juggling multiple clouds, third-party platforms are practically essential for a unified view.
- Maximum Control & Customization: If you have the engineering muscle, open-source offers unparalleled flexibility.
Many organizations actually land on a hybrid approach. They use native tools for basic infrastructure health checks while layering a third-party or open-source solution on top for deeper application performance insights.
Implementing a Monitoring Strategy That Actually Works
It's one thing to collect mountains of data; it's another thing entirely to turn it into something you can actually act on. A truly effective monitoring strategy isn't about watching every single metric flicker up and down. It's about zeroing in on what actually matters to your users and your business, building a system that helps your team respond intelligently, not just react to noise.

The foundation here is moving past basic system health checks like CPU usage. You have to define what a good user experience feels like in concrete terms and then measure your performance against that standard. This is exactly where Service Level Objectives (SLOs) come into play.
Define What Success Looks Like with SLOs
A Service Level Objective (SLO) is a specific, measurable target for your system's reliability. Instead of a vague goal like "the website should be fast," a proper SLO says, "99.5% of all homepage requests should be served in under 400 milliseconds." This simple shift changes everything.
SLOs are the bridge connecting your technical performance to your users' happiness. They give you a clear, data-driven way to answer the critical question: "Is our service reliable enough?"
Here’s a practical way to get started:
- Identify User Journeys: Map out the most critical things users do in your application. Think logging in, searching for a product, or checking out.
- Choose Key Indicators: For each of those journeys, pick a metric that defines success. This could be latency, error rate, or simple availability.
- Set a Realistic Target: Define a clear percentage and a performance threshold. Your goal isn't an impossible 100%; it's what your users actually need.
By focusing on SLOs, you stop chasing an imaginary state of perfection and start managing an "error budget." This budget gives your team the freedom to innovate and take calculated risks, as long as they don't compromise the user experience defined by your objectives.
Build Dashboards That Tell a Story
Dashboards are your command center, but a poorly designed one is just a wall of noise. The goal is to deliver at-a-glance information that’s tailored to different people. The view your on-call engineer needs is completely different from what your CTO wants to see.
A good dashboard tells a story. It starts with the big picture and lets you drill down into the nitty-gritty. For instance, a high-level dashboard might show the overall health of your application based on key SLOs. If an SLO suddenly turns red, an engineer can click through to a more detailed view showing metrics for the specific services involved, helping them find the root cause in minutes, not hours. A well-thought-out approach to resource and capacity planning helps tremendously in deciding which metrics are critical enough to earn a spot on these dashboards.
Create Alerts That People Actually Heed
Alert fatigue is a massive, and very real, problem. If your team gets pinged constantly for low-priority issues, they will eventually start tuning everything out, even the important stuff. Effective monitoring in the cloud relies on smart, automated alerts that only fire when a human actually needs to get involved.
Your alerts should always be:
- Actionable: Every single alert should come with clear instructions or a link to a runbook explaining exactly what to do.
- Urgent: Only send an alert for issues that pose an immediate or impending threat to the user experience.
- Symptom-Based: Alert on problems users are actually feeling (like high error rates) rather than on underlying causes (like high CPU) that might not be impacting anyone.
When you put these practices in place, monitoring transforms from a passive data-collection chore into a dynamic process that actively improves your system’s reliability and performance.
How Monitoring Drives Cloud Cost Optimization
Let's be honest, effective monitoring isn't just a tech concern for uptime and reliability; it's a powerful financial strategy. It’s the bridge between what your engineers are building and what your finance team is paying for, a practice often called FinOps. By shining a light on exactly how you’re using the cloud, monitoring hands you the data you need to plug financial leaks and stop paying for resources you aren't actually using.

The cloud's pay-as-you-go model is a classic double-edged sword. Sure, it offers incredible flexibility, but it also makes it frighteningly easy to rack up hidden costs from forgotten projects or underused resources. This is where the raw data from your monitoring tools becomes your best defense against waste.
Uncovering Hidden Cloud Waste
Without clear data, trying to identify waste is just a guessing game. Monitoring gives you the hard evidence you need to make smart, confident cost-saving decisions. It exposes some of the most common ways money quietly drains away.
Here are a few of the usual suspects:
- Zombie Instances: These are the ghosts in the machine: compute resources that were spun up for a quick test or a temporary task and then never shut down. They just sit there, idle, burning through your budget day after day.
- Overprovisioned Resources: It's human nature to overestimate, which often leads to databases or servers with way more capacity than they ever use. Monitoring CPU utilization and memory usage metrics tells you exactly which resources can be safely downsized without impacting performance.
- Abandoned Storage: Think of these as digital artifacts. Unattached storage volumes or old snapshots can linger for months, sometimes years, racking up charges long after the server they belonged to is gone.
By digging into these metrics, you can confidently rightsize your infrastructure. For teams looking to take it a step further, a solid foundation of monitoring data can support a whole range of cloud cost optimization strategies. This data-driven approach is the only way to truly maximize your return on every dollar you spend in the cloud.
From Technical Data to Financial Strategy
This is the point where monitoring transforms from a purely technical task into a cornerstone of your financial planning. When your engineering teams can see the real-time cost impact of their infrastructure choices, they naturally start making smarter, more cost-aware decisions.
Monitoring provides the objective truth about your resource consumption. It empowers you to challenge assumptions, validate downsizing decisions, and ensure every dollar spent on the cloud delivers real value to the business.
This continuous feedback loop turns cost optimization into an ongoing habit, not a one-off project. For instance, by tracking usage patterns, you might notice predictable lulls in demand on evenings or weekends. That single insight lets you automate shutdowns for all your non-production environments, a simple move that can slash their costs by up to 70%.
Platforms like CLOUD TOGGLE are built to act on exactly this kind of insight, turning monitoring data into automated, hands-off savings. In the end, monitoring in the cloud is what ensures your spending is always perfectly aligned with your actual needs.
The Future Is Proactive with AIOps
The next big step in cloud monitoring isn't about getting more alerts; it's about getting smarter ones and automating the response. This is where AIOps, or AI for IT Operations, comes in. Think of it as applying a layer of machine learning directly on top of your monitoring data.
Suddenly, your monitoring setup transforms from a reactive alarm system into a proactive engine that can actually prevent problems before they start. Instead of your engineers getting buried under an avalanche of alerts, AIOps platforms can automatically connect the dots between related events, drastically cutting down the noise and pointing straight to the root cause.
From Reaction to Prediction
AIOps brings some powerful new tricks to the table, like anomaly detection. This is the system’s ability to automatically spot weird patterns that a human would almost certainly miss. For example, it could flag a slow, tiny memory leak that seems harmless now but is on a path to cause a catastrophic outage in a few days.
It also gives us predictive analytics, allowing us to forecast future problems by analyzing historical trends. It’s like having a crystal ball for your infrastructure.
This move toward intelligent automation is already paying off. AI-driven monitoring is boosting IT resource utilization by a staggering 25-30%, helping companies slash waste and respond to incidents faster.
AIOps helps teams move from constantly fighting fires to preventing them entirely. It manages the complexity of modern cloud environments with an efficiency that manual processes simply cannot match.
For teams building machine learning systems, knowing if your models are performing correctly in the real world is everything. This is where a solid AI observability strategy becomes essential. To get a better handle on this shift, you can learn more about how AI is shaping cloud management and stay ahead of the curve.
Of course. Here is the rewritten section, crafted to sound human-written and match the provided style guide.
Common Questions About Monitoring in the Cloud
Even with a solid plan, a few practical questions always seem to pop up once you start putting a cloud monitoring strategy into practice. Let's tackle some of the most common challenges teams run into so you can move forward with confidence.
How Much Monitoring Is Too Much?
It’s incredibly easy to fall into the trap of collecting every metric, log, and trace you can get your hands on. But the goal is observability, not data hoarding.
A good rule of thumb is to start with your Service Level Objectives (SLOs). Monitor what you need to track your SLOs and the critical user journeys they represent. If a metric doesn’t help you understand the user experience or diagnose a real problem faster, you have to ask if you really need it. Over-collecting data just leads to higher costs and a ton of alert noise.
What Is the Difference Between Monitoring and Observability?
This one causes a lot of confusion, but the distinction is pretty straightforward when you think about it.
- Monitoring is what you do when you already know what to look for. You're watching known metrics like CPU usage or error rates to see if they cross a threshold you've set. It answers questions you already know to ask.
- Observability is what you need when you're dealing with the unknown. It’s the ability to ask new questions about your system on the fly, without having to ship new code. This relies on rich data from logs, metrics, and traces that let you explore and understand completely unexpected behaviors.
Monitoring tells you that something is wrong. Observability helps you figure out why it's wrong, even if you’ve never seen that specific problem before. A truly observable system is always built on a strong foundation of well-planned monitoring.
Can We Just Use Our Cloud Provider's Native Tools?
Absolutely. Especially if your entire world lives within a single provider like AWS or Azure. Native tools like Amazon CloudWatch and Azure Monitor are powerful, deeply integrated, and often the easiest way to get started.
The catch comes when you operate in a multi-cloud or hybrid environment. Relying only on native tools creates blind spots and forces your teams to juggle multiple dashboards. Third-party platforms can provide a single, unified view across all your systems, which becomes essential for managing complexity and avoiding vendor lock-in as your company grows.
Effective monitoring shows you exactly when your resources are idle and costing you money. CLOUD TOGGLE takes that insight and turns it into automated savings. Stop paying for servers you aren't using and start optimizing your cloud spend with simple, powerful scheduling. Discover how much you can save at cloudtoggle.com.